Index
This topic area covers statistics and information relating to mental health, emotional wellbeing and loneliness among adults in Hull including local strategic need and service provision. Further information relating to Mental Health and Emotional Wellbeing Among Children and Young People and Children with Special Educational Needs or Disabilities is given under Health Factors within Children and Young People. Further information on Learning Disabilities and Mental Ill Health is provided under Vulnerable Groups. Information relating to self-harm can be found within Suicide and Self-Harm under Health Factors under Adults. Information relating to hospital admissions for self-harm, alcohol and substance use can be found within A&E Attendances and Hospital Admissions under Health Factors under Children and Young People. Emotional health and wellbeing information has been collected within Hull’s Health and Wellbeing Surveys and full reports are available under Surveys within Tools and Resources. A needs assessment was completed in Hull during 2023 for people with multiple unmet needs which included people who had poor mental health. The report – which was finalised in 2024 – is available within Multiple Unmet Needs under Vulnerable Groups.
This page contains information from the Office for Health Improvement & Disparities’ Fingertips. Information is taken ‘live’ from the site so uses the latest available data from Fingertips and displays it on this page. As a result, some comments on this page may relate to an earlier period of time until this page is next updated (see review dates at the end of this page).
In July 2022, Clinical Commissioning Groups (CCGs) ceased to exist and were replaced by the Integrated Care System. The sub Integrated Care Board areas which include Hull are within the Humber and North Yorkshire Integrated Care Board. In Fingertips, the sub-ICB area referenced by 03F relates to Hull (see Integrated Care Board for the codes relating to the other local sub-ICB areas). For some indicators on Fingertips, the data is still being presented at CCG level (and for Humber, Coast and Vale) and has not yet been updated for sub-ICBs. However, for Hull the geographical area for the CCG and the sub-ICB area (03F) are the same so the information can still be examined and compared to understand the health needs within Hull.
Headlines
- Mental health is an integral and essential component of health.
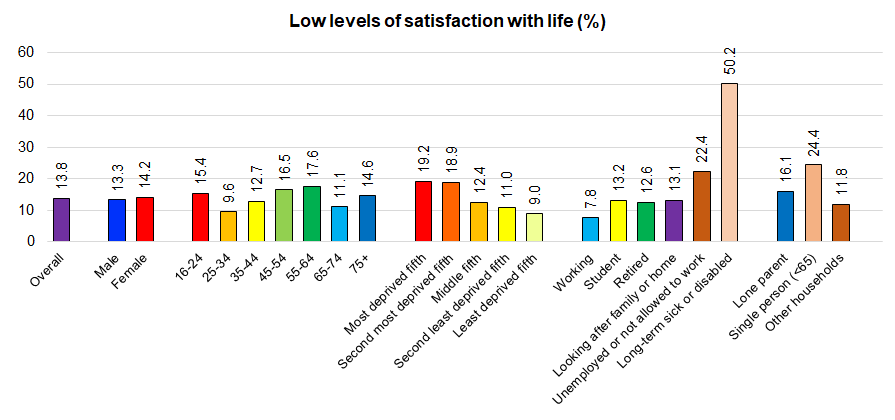
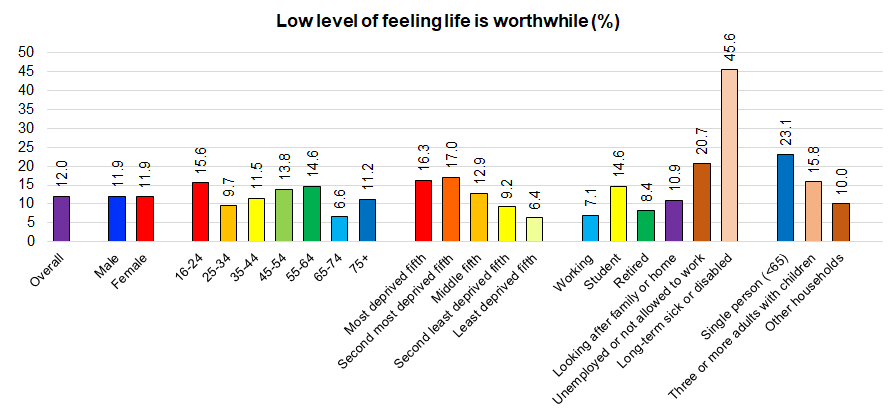
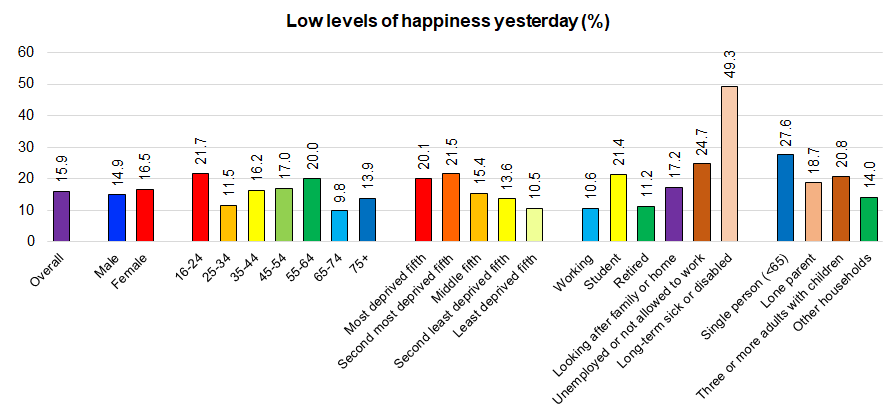
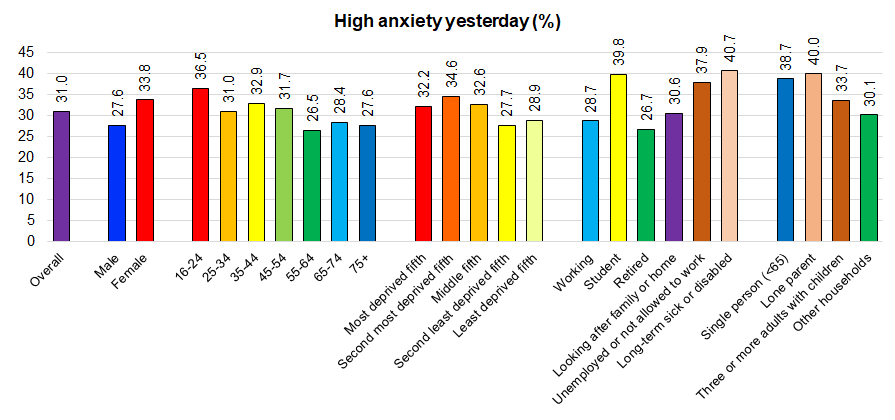
- From Hull’s Adult Health and Lifestyle Survey 2019, 13.8% people had low levels of satisfaction with their lives, 12.0% had low levels of feeling their life was worthwhile, 15.9% had low levels of happiness yesterday and 31.0% had high levels of anxiety yesterday. The wellbeing measures were the worst among those aged 16-24 years and generally next highest among those aged 55-64 years. People living in the most deprived two-fifths of areas were twice as likely to report poor outcomes compared to people living in the least deprived fifth of areas of Hull. People who were unemployed and who were aged under 65 years who lived alone also had the among the highest prevalence of poor outcomes, but the highest prevalence was among those who were not working due to long-term illness or disability where around 50% had poor levels of satisfaction with life, feeling life was worthwhile and happiness (40% for high anxiety). In addition to the groups mentioned above, students and lone parents also had among the highest levels of anxiety.
- The same wellbeing measures have been measured nationally at local authority level, and have been much lower in Hull compared to the local survey (which is likely to be more representative of Hull’s population due to the larger number of survey responders). From the national survey, the percentage with low satisfaction with life and low worthwhile scores has increased during the COVID-19 pandemic (in 2020/21 and 2021/22), but have both decreased sharply in Hull between 2021/22 and 2022/23. Whilst the percentage is higher in Hull compared to England for satisfaction with life, for the worthwhile score, the percentage with a low score in Hull is the same as England for 2022/23. From the national survey, the percentage with a low happiness score decreased in Hull between 2019/20 and 2020/21, but has gradually increased between 2020/21 and 2022/23. The percentage with high levels of anxiety has increased sharply between 2019/20 and 2022/23. Given the high levels of deprivation in Hull and the ongoing cost of living crisis in Hull, it is surprising that the satisfaction with life and worthwhile scores have both decreased in the recent year, but the happiness and anxiety score may be more reflective of the situation in Hull. It is possible that the results are due to relatively small numbers of people being surveyed in Hull.
- In 2007, it was estimated that 20.5% of the patient population registered with Hull GPs have a common mental health disorder which is higher than England (16.9%). In 2022/23, there were 31,970 patients (13.0%) registered with Hull GPs who had a record of unresolved depression within their patient record that had been diagnosed on or after 1st April 2006 (slightly lower than England at 13.2%). During 2022/23, there had been 3,378 new cases of depression diagnosed among Hull’s patients (1.4%) which was the same percentage as for England.
- In the GP Patient Survey, 11.3% reported a long-term mental health problem and 15.9% reported depression and anxiety (both higher than England – 9.9% and 13.7% respectively).
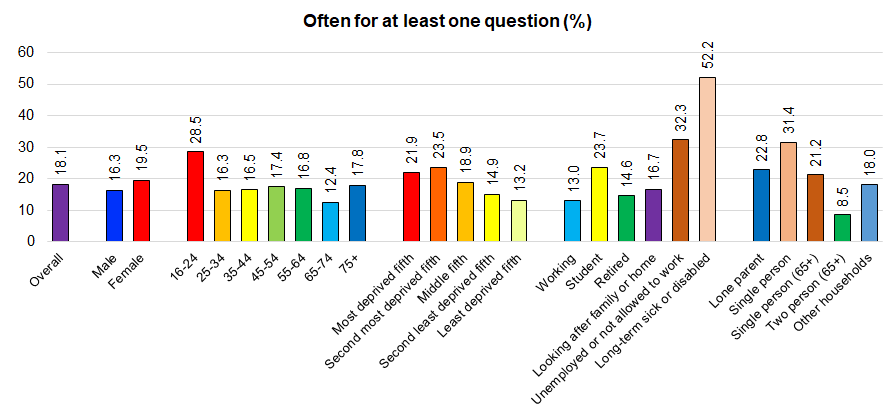
- From Hull’s Adult Health and Lifestyle Survey 2019, around one in ten people stated that they often lacked companionship, often felt left out, often felt isolated from others, and often felt lonely with 18% stating ‘often’ to one or more of these four questions. People aged 16-24 years, living in the most deprived areas of Hull, who were unemployed, who were not working due to long-term illness or disability, or were aged under 65 years and lived alone were the most likely to report that they often lacked companionship, often felt left out, often felt isolated from others, or often felt lonely.
- It is estimated that around 30,000 people aged 18-64 years in Hull have common mental disorders, around 4,000 borderline personality disorders, over 5,500 antisocial personality disorders, around 1,150 psychotic disorders, and 11,800 two or more psychiatric disorders.
- It is recognised the mental and emotional wellbeing has been detrimentally affected for many adults and children due to COVID-19 and lockdowns. Furthermore, the effect has not been felt evenly across society and the most vulnerable have generally been affected the worst, increasing the inequalities gap between both Hull and England, and within Hull. Recognition is not sufficient and increased resources need to be made available to improve mental health and emotional wellbeing particularly among those most affected.
The Population Affected – Why Is It Important?
The World Health Organisation (WHO) defines mental health, examines determinants of mental health, looks at mental health promotion and protection as well as treatment and care in relation to mental health.
WHO state that mental health is an integral and essential component of health. The WHO constitution states: “Health is a state of complete physical, mental and social well-being and not merely the absence of disease or infirmity.” An important implication of this definition is that mental health is more than just the absence of mental disorders or disabilities.
WHO state mental health is a state of well-being in which an individual realises his or her own abilities, can cope with the normal stresses of life, can work productively and is able to make a contribution to his or her community. Mental health is fundamental to our collective and individual ability as humans to think, emote, interact with each other, earn a living and enjoy life. On this basis, the promotion, protection and restoration of mental health can be regarded as a vital concern of individuals, communities and societies throughout the world.
They go on to say that multiple social, psychological, and biological factors determine the level of mental health of a person at any point of time. For example, violence and persistent socio-economic pressures are recognized risks to mental health. The clearest evidence is associated with sexual violence. Poor mental health is also associated with rapid social change, stressful work conditions, gender discrimination, social exclusion, unhealthy lifestyle, physical ill-health and human rights violations. There are specific psychological and personality factors that make people vulnerable to mental health problems. Biological risks include genetic factors.
Thus poor mental health can have a detrimental effect on all aspects of life undermining self-esteem, confidence and enthusiasm for life. Social and emotional well-being in children creates the foundations for healthy behaviours and educational attainment. It also helps prevent behavioural problems (including substance misuse) and mental health problems. Social and emotional well-being provides personal competencies (such as emotional resilience, self-esteem and interpersonal skills) that help to protect against risks relating to social disadvantage, family disruption and other adversity in life. Such competencies provide building blocks for personal development which will enable children and young people to take advantage of life chances.
Evidence shows that poor social and emotional wellbeing predicts a range of negative outcomes in adolescence and adulthood. The National Institute for Health and Care Excellence state that negative parenting and poor quality family or school relationships place children at risk of poor mental health. Early intervention in childhood can help reduce physical and mental health problems and prevent social dysfunction being passed from one generation to the next.
A general low mood can include sadness, anxiety, worry, tiredness, low self-esteem, frustration and anger and people with poor mental health sometimes can deal with this by smoking more, eating excessively and unhealthy diets and not exercising. Depression can involve continuous low mood, feelings of hopelessness and helplessness, low self-esteem, feeling tearful, feeling irritable and intolerant of others, having no motivation of interest in things, finding it difficult to make decisions, not getting any enjoyment out of life, having suicidal thoughts or thoughts of self-harming, and feeling anxious or worried. As a consequence, poor mental health influences all aspects of life, a person’s physical health, their family, their education and training, their workplace and employment, and their involvement in their community.
The diagnosed prevalence of depression and severe mental illness can be examined from data collected as part of the Quality and Outcomes Framework within primary care. Quality of care indicators are also included, and it means that high percentage of the patients diagnosed with depression and severe mental illness have annual reviews which gives medical staff the opportunity to provide information and encourage their patients to improve their lifestyle behaviours to improve their health, and lower their risk of morbidity and mortality from their condition. Information relating to Mental Ill Health is given within Vulnerable Groups. Local analysis of the QOF data has been completed with prevalence calculated for each GP practice and Primary Care Network group.
The Hull Picture
Incidence and Prevalence
Common Mental Disorders (Modelled Estimates)
The Office for Health Improvement & Disparities’ Fingertips presents information for Hull (03F) – based on patients registered with Hull GPs – in relation to modelled estimates of the prevalence of common mental disorders. The estimates of common mental disorders are based on applying the prevalence estimates from the national Adult Psychiatric Morbidity Survey completed in 2014 and applied to Hull’s population structure. Specific prevalence estimates have been used for each age group and for different levels of deprivation for males and females separately.
In their models estimated for 2017, the prevalence of common mental disorders was considerably higher in Hull compared to England being 21% higher among those aged 16+ years and 25% for those aged 65+ years.
Compared with benchmark
| Indicator | Period | England | NHS Humber and North Yorkshire Integrated Care Board - QOQ | Humber and North Yorkshire ICB - 02Y | Humber and North Yorkshire ICB - 03F | Humber and North Yorkshire ICB - 03H | Humber and North Yorkshire ICB - 03K | Humber and North Yorkshire ICB - 03Q |
|---|---|---|---|---|---|---|---|---|
Estimated prevalence of common mental disorders: % of population aged 16 & over (Persons 16+ yrs) | 2017 | 16.9 | - | 14.4 | 20.5 | 18.1 | 16.8 | 14.2 |
Estimated prevalence of common mental disorders: % of population aged 65 & over (Persons 65+ yrs) | 2017 | 10.2 | - | 9.5 | 12.7 | 11.0 | 10.4 | 8.7 |
Unresolved Record of Depression on GP Register
Fingertips also presents information on the prevalence of unresolved depression at sub Integrated Care Board level based on patients registered with Hull GPs from information from the Quality and Outcomes Framework. It is the percentage of patients aged 18+ years diagnosed on or after 1st April 2006 who have an unresolved record of depression in their patient record. However, the indicator was removed from the Quality and Outcomes Framework in 2023/24 so the latest data is for 2022/23.
For 2022/23, the percentage in Hull (03F) is only marginally lower than England (13.0% versus 13.2%), but given the relationship between depression and deprivation, this suggests that there is a higher rate of undiagnosed depression in Hull.
Compared with benchmark
| Indicator | Period | England | NHS Humber and North Yorkshire Integrated Care Board - QOQ | Humber and North Yorkshire ICB - 02Y | Humber and North Yorkshire ICB - 03F | Humber and North Yorkshire ICB - 03H | Humber and North Yorkshire ICB - 03K | Humber and North Yorkshire ICB - 03Q | Humber and North Yorkshire ICB - 42D |
|---|---|---|---|---|---|---|---|---|---|
Depression: QOF prevalence - retired after 2022/23 (Persons 18+ yrs) | 2022/23 | 13.2 | 13.1 | 12.1 | 13.0 | 13.7 | 16.1 | 12.4 | 12.8 |
Between 2009/10 and 2020/21, the prevalence of an unresolved record of deprivation among patients aged 18+ years has tripled, although some of the increase will be due to increased case finding (since the indicator was first introduced) and possibly better recording. Therefore, it is difficult to ascertain the true extent of the increase. There has been similar increases both for England and across Humber and North Yorkshire Integrated Care Board.
In 2022/23, there were 31,970 patients aged 18+ years registered with Hull GPs who had a record of unresolved depression within their patient notes who had been diagnosed on or after 1st April 2006.
Compared with benchmark
Depression: QOF prevalence - retired after 2022/23 (Persons 18+ yrs)
|
Period
|
Humber and North Yorkshire ICB - 03F |
NHS Humber and North Yorkshire Integrated Care Board - QOQ
|
England
|
||||
|---|---|---|---|---|---|---|---|
|
Count
|
Value
|
95%
Lower CI |
95%
Upper CI |
||||
| 2012/13 | • | 10738 | 4.7% | 4.6% | 4.8% | - | 5.8% |
| 2013/14 | • | 12976 | 5.7% | 5.6% | 5.8% | - | 6.5% |
| 2014/15 | • | 15958 | 7.0% | 6.9% | 7.1% | - | 7.3% |
| 2015/16 | • | 18001 | 7.7% | 7.6% | 7.8% | - | 8.3% |
| 2016/17 | • | 20045 | 8.2% | 8.1% | 8.4% | - | 9.1% |
| 2017/18 | • | 22153 | 9.4% | 9.3% | 9.5% | - | 9.9% |
| 2018/19 | • | 24614 | 10.4% | 10.3% | 10.5% | - | 10.7% |
| 2019/20 | • | 26742 | 11.2% | 11.1% | 11.3% | 11.2% | 11.6% |
| 2020/21 | • | 28697 | 12.0% | 11.9% | 12.1% | 11.8% | 12.3% |
| 2021/22 | • | 30458 | 12.6% | 12.5% | 12.7% | 12.5% | 12.7% |
| 2022/23 | • | 31970 | 13.0% | 12.9% | 13.2% | 13.1% | 13.2% |
Source: NHS England
From a local analysis, it was found that there was no difference in the prevalence of unresolved record of deprivation among patients aged 18+ years in relation to either average patient age or average deprivation score (based on Index of Multiple Deprivation) for the 28 GP practices in Hull for 2022/23. The prevalence of mental health issues does tend to be higher among people living in more deprived areas, so it could be that people in more deprived areas are not visiting their GP about this and there are more cases that are undiagnosed or that any association may not be strong enough to be statistically significant.
New Cases of Depression on GP Registers
As part of the Quality and Outcomes Framework, the number of new diagnoses are also recorded so it is possible to examine incidence of (newly) diagnosed depression as well as prevalence above for 2022/23.
For 2023/24, there were 3,198 patients who were aged 18+ years who were newly diagnosed with depression among Hull patients registered with Hull (03F) GPs which represents 1.3% of adult patients. This percentage lower in Hull than the England average, but similar to the average across the Humber and North Yorkshire Integrated Care Board.
Compared with benchmark
| Indicator | Period | England | NHS Humber and North Yorkshire Integrated Care Board - QOQ | Humber and North Yorkshire ICB - 02Y | Humber and North Yorkshire ICB - 03F | Humber and North Yorkshire ICB - 03H | Humber and North Yorkshire ICB - 03K | Humber and North Yorkshire ICB - 03Q | Humber and North Yorkshire ICB - 42D |
|---|---|---|---|---|---|---|---|---|---|
Depression: QOF incidence - new diagnosis (Persons 18+ yrs) | 2023/24 | 1.5 | 1.2 | 1.2 | 1.3 | 2.1 | 1.4 | 0.9 | 1.0 |
There had been a gradual increase in the incidence of depression in Hull to a high of 1.9% in 2018/19, and since then the percentage has decreased to 1.3% for 2023/24. The initial increase is probably expected given it can take some time to add include patients on the QOF registers when a new indicator is introduced.
Compared with benchmark
Depression: QOF incidence - new diagnosis (Persons 18+ yrs)
|
Period
|
Humber and North Yorkshire ICB - 03F |
NHS Humber and North Yorkshire Integrated Care Board - QOQ
|
England
|
||||
|---|---|---|---|---|---|---|---|
|
Count
|
Value
|
95%
Lower CI |
95%
Upper CI |
||||
| 2013/14 | • | 2718 | 1.2% | 1.2% | 1.2% | 1.0% | 1.1% |
| 2014/15 | • | 3290 | 1.4% | 1.4% | 1.5% | 1.2% | 1.2% |
| 2015/16 | • | 3877 | 1.7% | 1.6% | 1.7% | 1.4% | 1.4% |
| 2016/17 | • | 3782 | 1.6% | 1.5% | 1.6% | 1.4% | 1.5% |
| 2017/18 | • | 3885 | 1.6% | 1.6% | 1.7% | 1.5% | 1.6% |
| 2018/19 | • | 4541 | 1.9% | 1.9% | 2.0% | 1.5% | 1.7% |
| 2019/20 | • | 4031 | 1.7% | 1.6% | 1.7% | 1.5% | 1.5% |
| 2020/21 | • | 3898 | 1.6% | 1.6% | 1.7% | 1.4% | 1.4% |
| 2021/22 | • | 3608 | 1.5% | 1.4% | 1.5% | 1.5% | 1.5% |
| 2022/23 | • | 3378 | 1.4% | 1.3% | 1.4% | 1.3% | 1.4% |
| 2023/24 | • | 3198 | 1.3% | 1.2% | 1.3% | 1.2% | 1.5% |
Source: NHS England
Self-Reported Long-Term Mental Health Problems
From the GP patient survey in 2018/19, 11.3% of patients aged 16+ years registered with Hull GPs reported that they had a long-term mental health problem which was higher than England (9.9%). From the same survey but for 2016/17, the percentage of patients aged 18+ years reporting depression and anxiety was also higher in Hull (15.9%) compared to England (13.7%).
Compared with benchmark
| Indicator | Period | England | Humber, Coast and Vale (pre 4/20) | NHS East Riding Of Yorkshire CCG | NHS Hull CCG | NHS North East Lincolnshire CCG | NHS North Lincolnshire CCG | NHS Vale Of York CCG |
|---|---|---|---|---|---|---|---|---|
Long-term mental health problems (GP Patient Survey): % of respondents (Persons 16+ yrs) | 2018/19 | 9.9 | - | 8.3 | 11.3 | 13.8 | 9.4 | 10.8 |
Measures of Wellbeing
An Adult Health and Wellbeing Survey was conducted in Hull during 2019 involving over 4,000 adults aged 16+ years. Further information and the full reports are available under Surveys within Tools and Resources. The survey asked four questions relating to mental wellbeing that have also been used nationally, and as a result the prevalence estimates from the local survey can be compared with the prevalence in Hull from the national survey. The numbers involved in the local survey were considerably higher than the numbers surveyed in Hull for the national survey, and due to the way the local survey was conducted, it is likely that the survey responders in the local survey are more representative of Hull’s overall population. The prevalence estimates from the local survey were based on a much higher number of Hull survey responders compared to the national survey.
The four questions were “Overall, how satisfied are you with your life nowadays?”, “Overall, to what extent do you feel the things that you do in your life are worthwhile?”, “Overall, how happy did you feel yesterday?” and “Overall, how anxious did you feel yesterday?”. Each of the four questions had a response scale from 0 “not at all” to 10 “completely”. Poor or low levels of satisfaction, of feeling worthwhile, and of happiness were recorded as having a score of 0-4 and poor or high levels of anxiety were recorded as having a score of 6-10.
Satisfaction With Life
In relation to age, the lowest levels of satisfaction with life occurred for those aged 45-64 years and 16-24 years. There was a marked association with deprivation with low levels of satisfaction twice as high among people living in the most deprived fifth compared to the least deprived fifth of areas of Hull. The most marked difference occurred in relation to working status where over half of people who were not working due to long-term illness and disability reported low levels of satisfaction with their life, and 22% of those who were unemployed or not allowed to work (asylum seekers etc). Almost one-quarter of people who were aged under 65 years and who lived alone also had low levels of satisfaction with their lives. Among survey responders aged under 65 years, the single person households had a higher percentage of males aged 35-64 years (42% versus 24% for all other households type where the survey responder was aged under 65 years) and females aged 55-64 years (19% versus 8% for all other households types where the survey responder was aged under 65 years). So it appears that this group could include people who are separated or divorced as well as single individuals.
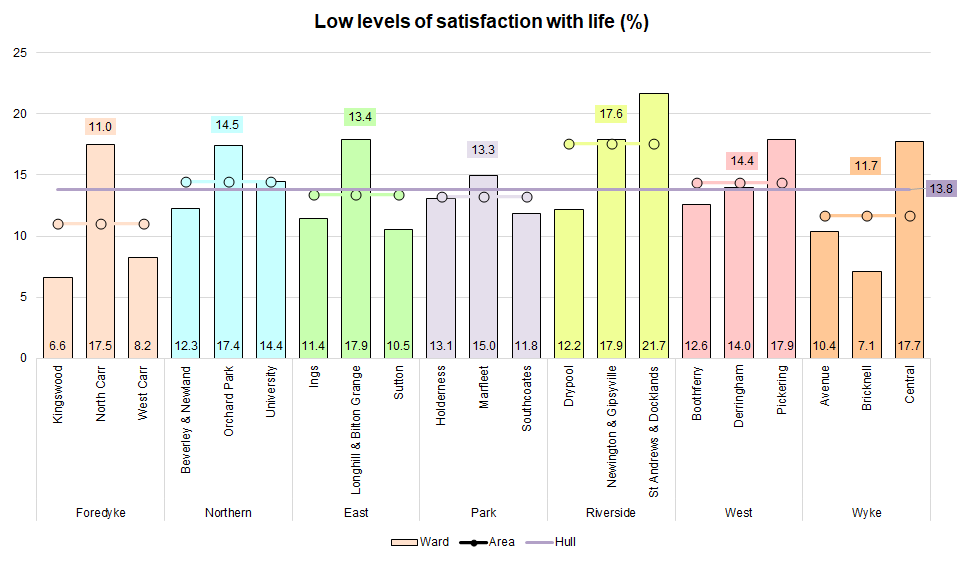
The percentage of people who had low levels of satisfaction with their lives was highest in St Andrew’s & Docklands wards at 22% with the next highest wards around 18% (North Carr, Orchard Park, Longhill & Bilton Grange, Newington & Gipsyville, Pickering, and Central).
The Office for Health Improvement & Disparities’ Fingertips presents information from the national survey.
For 2022/23, the percentage of people with a low satisfaction with life was higher in Hull (6.3%) compared to England (5.6%) although it was similar to the average across the region (6.4%).
Compared with benchmark
| Indicator | Period | England | Yorkshire and the Humber region (statistical) | Kingston upon Hull | East Riding of Yorkshire | North East Lincolnshire | North Lincolnshire | York | Barnsley | Doncaster | Rotherham | Sheffield | Bradford | Calderdale | Kirklees | Leeds | Wakefield | North Yorkshire Cty |
|---|---|---|---|---|---|---|---|---|---|---|---|---|---|---|---|---|---|---|
Self reported wellbeing: people with a low satisfaction score (Persons 16+ yrs) | 2022/23 | 5.6 | 6.4 | 6.3 | 7.3 | 5.9 | 4.9 | 3.7 | 6.8 | 7.2 | 4.5 | 6.9 | 10.2 | 9.4 | 6.2 | 3.8 | 8.5 | 5.0 |
As mentioned above the rates are dramatically lower in the national survey for Hull (6.3% in 2022/23) compared to the local survey (13.8% in 2019). The time periods of the two surveys differ, however, it does not make much difference as regardless of the survey year of the national survey, the prevalence from the national survey is consistently lower than the local survey. In Hull, from the national survey, the percentage of people aged 16+ years with a low level of satisfaction with their life has decreased from 7-8% between 2011/12 to 2015/16 to 5-6% between 2016/17 to 2019/20. The percentage increased in Hull between 2019/20 from 6.3% to 8.2% for 2020/21 which could be associated with the COVID-19 pandemic and cost of living crisis, and remained high for 2021/22. However, the rates have decreased quite sharply between 2021/22 and 2022/23 back to pre-pandemic levels.
In the last year there has been an increase nationally and regionally, yet a decrease in Hull which is unexpected given the ongoing cost of living crisis and Hull’s high levels of deprivation. The Annual Population Survey from which this indicator is measured may have relatively few people living in Hull participating in the survey, and potential biases in the survey is a potential reason for the differences in the percentage compared to the local survey and the unexpected decrease in Hull.
Compared with benchmark
Self reported wellbeing: people with a low satisfaction score (Persons 16+ yrs)
|
Period
|
Kingston upon Hull |
Yorkshire and the Humber region (statistical)
|
England
|
||||
|---|---|---|---|---|---|---|---|
|
Count
|
Value
|
95%
Lower CI |
95%
Upper CI |
||||
| 2011/12 | • | - | 6.5% | 4.9% | 8.2% | 7.1% | 6.5% |
| 2012/13 | • | - | 8.5% | 6.6% | 10.4% | 6.3% | 5.7% |
| 2013/14 | • | - | 7.3% | 5.4% | 9.2% | 6.1% | 5.6% |
| 2014/15 | • | - | 7.8% | 5.8% | 9.8% | 5.6% | 4.7% |
| 2015/16 | • | - | 6.7% | 4.8% | 8.6% | 4.8% | 4.6% |
| 2016/17 | • | - | 5.3% | 3.6% | 7.1% | 5.1% | 4.5% |
| 2017/18 | • | - | 5.0% | 3.2% | 6.8% | 4.9% | 4.4% |
| 2018/19 | • | - | 6.1% | 4.1% | 8.2% | 5.1% | 4.3% |
| 2019/20 | • | - | 6.4% | 4.1% | 8.6% | 4.9% | 4.7% |
| 2020/21 | • | - | 8.2% | 4.8% | 11.7% | 6.6% | 6.1% |
| 2021/22 | • | - | 8.3% | 5.0% | 11.5% | 5.1% | 5.0% |
| 2022/23 | • | - | 6.3% | 3.4% | 9.1% | 6.4% | 5.6% |
Source: Office for National Statistics
Feeling Life is Worthwhile
Examining to what extent people felt the things people they do in their lives were worthwhile showed a similar pattern to satisfaction with life. People aged 16-24 years had the highest percentages of low levels of feeling their life was worthwhile followed by those aged 55-64 years and 45-54 years. There was also a very strong association with deprivation with more than twice as many people living in the most deprived fifth of areas of Hull having low levels of feeling their life was worthwhile compared to people living in the least deprived fifth of areas of Hull. Again, people who were not working due to long-term illness and disability, and who were unemployed had the worst responses. Overall, 23% of people who were aged under 65 years and lived alone had low levels of feeling their life was worthwhile as did 16% of people who lived in households with three or more adults and child(ren).
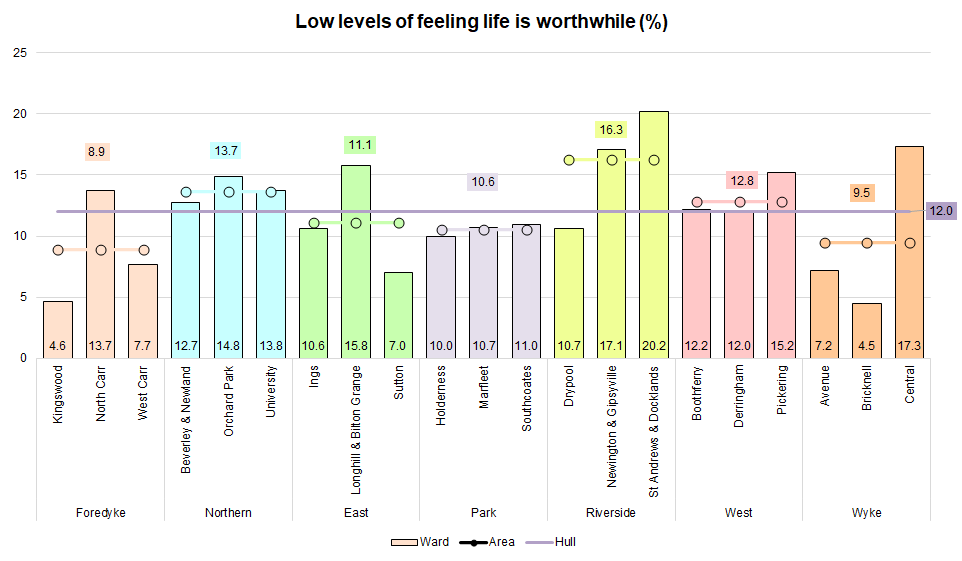
One in five survey responders who lived in St Andrew’s & Docklands ward had a low level of feeling their life was worthwhile, and the percentage was next highest for people living in Newington & Gipsyville, and Central wards (both 17%).
The percentage of people with a low worthwhile score is the same as England for 2022/23 at 4.4%, and among the lowest across the region. This is a surprise given Hull’s increased levels of deprivation and the ongoing cost of living crisis. It is also possible that results are not reflective of the true situation in Hull due to relatively small number of people participating in the national survey.
Compared with benchmark
| Indicator | Period | England | Yorkshire and the Humber region (statistical) | Kingston upon Hull | East Riding of Yorkshire | North East Lincolnshire | North Lincolnshire | York | Barnsley | Doncaster | Rotherham | Sheffield | Bradford | Calderdale | Kirklees | Leeds | Wakefield | North Yorkshire Cty |
|---|---|---|---|---|---|---|---|---|---|---|---|---|---|---|---|---|---|---|
Self reported wellbeing: people with a low worthwhile score (Persons 16+ yrs) | 2022/23 | 4.4 | 5.3 | 4.4 | 6.7 | 3.1 | 4.8 | 2.7 | 6.4 | 2.6 | 6.3 | 6.5 | 6.8 | 6.7 | 5.2 | 3.7 | 7.8 | 4.9 |
The percentage from the national survey has been relatively consistent for Hull over time ranging from 4.7% in both 2013/14 and 2017/18 to 6.3% in 2015/16 with the exception of 2020/21 and 2021/22 likely associated with the COVID-19 pandemic and cost of living crisis.
As mentioned above the rates are considerably lower in the national survey for Hull (4.4% in 2022/23) compared to the local survey (12.0% in 2019). Again, it does not really matter what time period is used for the national survey, it is consistently lower than than the local survey between 4% and 6% between 2011/12 and 2018/19. The increase for 2020/21 and 2021/22, is not surprising with the pandemic, lockdowns and furloughs, and the subsequent cost of living crisis, but it is surprising that the percentage in Hull has decreased so much between 2021/22 and 2022/23.
Compared with benchmark
Self reported wellbeing: people with a low worthwhile score (Persons 16+ yrs)
|
Period
|
Kingston upon Hull |
Yorkshire and the Humber region (statistical)
|
England
|
||||
|---|---|---|---|---|---|---|---|
|
Count
|
Value
|
95%
Lower CI |
95%
Upper CI |
||||
| 2011/12 | • | - | 5.5% | 3.8% | 7.2% | 4.8% | 4.8% |
| 2012/13 | • | - | 5.1% | 3.5% | 6.6% | 4.6% | 4.3% |
| 2013/14 | • | - | 4.7% | 3.1% | 6.3% | 4.6% | 4.2% |
| 2014/15 | • | - | 5.3% | 3.7% | 6.9% | 4.3% | 3.8% |
| 2015/16 | • | - | 6.3% | 4.3% | 8.3% | 3.9% | 3.6% |
| 2016/17 | • | - | 5.8% | 3.9% | 7.7% | 4.2% | 3.6% |
| 2017/18 | • | - | 4.7% | 2.9% | 6.5% | 4.0% | 3.6% |
| 2018/19 | • | - | 5.2% | 3.2% | 7.2% | 4.3% | 3.6% |
| 2019/20 | • | - | 5.2% | 3.0% | 7.3% | 4.4% | 3.8% |
| 2020/21 | • | - | 8.1% | 4.6% | 11.6% | 4.9% | 4.4% |
| 2021/22 | • | - | 9.4% | 3.3% | 15.4% | 4.0% | 4.0% |
| 2022/23 | • | - | 4.4% | 2.2% | 6.6% | 5.3% | 4.4% |
Source: Office for National Statistics
Happiness
Overall, 15.9% had low levels of happiness, and there was a very similar pattern for the percentages with a low level of happiness yesterday in relation to age, deprivation and employment status as noted in relation to satisfaction with life and feeling life was worthwhile. Almost half of people who were not working due to long-term illness or disability had a low level of happiness yesterday and one-fifth or more of those who were aged 16-24 years, 55-64 years, living in the most deprived two-fifths of areas of Hull, were students, unemployed or not working due to long-term illness or disability, who were aged under 65 years and lived alone, and those who lived in households with three or more adults with child(ren).
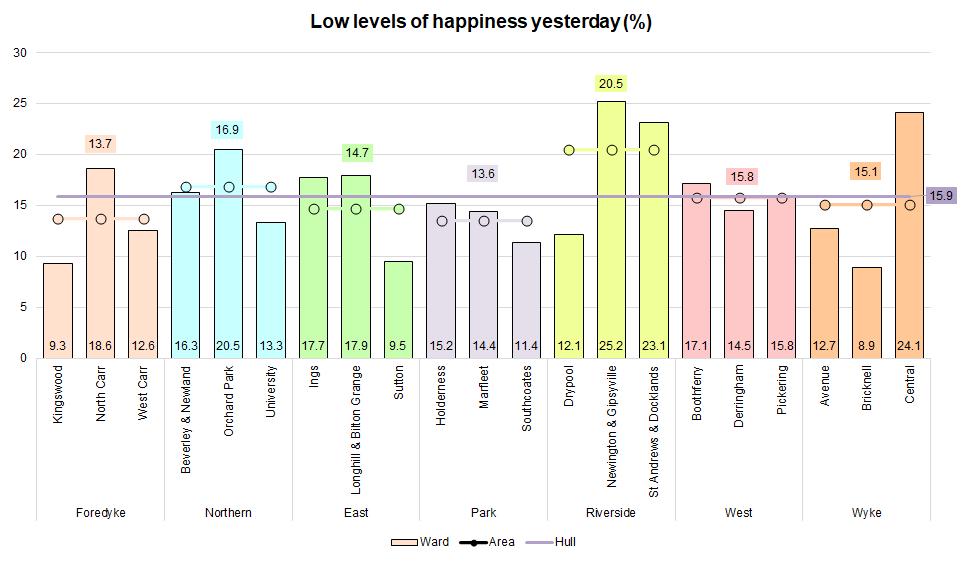
One-quarter of people living in Newington & Gipsyville ward had low levels of happiness, 24% of people living in Central ward, 23% of people living in St Andrew’s & Docklands ward and 21% of people living in Orchard Park ward.
In 2022/23, a higher percentage of people in Hull had a low happiness score (12.1%) compared to England (8.9%) and the region (9.6%).
Compared with benchmark
| Indicator | Period | England | Yorkshire and the Humber region (statistical) | Kingston upon Hull | East Riding of Yorkshire | North East Lincolnshire | North Lincolnshire | York | Barnsley | Doncaster | Rotherham | Sheffield | Bradford | Calderdale | Kirklees | Leeds | Wakefield | North Yorkshire Cty |
|---|---|---|---|---|---|---|---|---|---|---|---|---|---|---|---|---|---|---|
Self reported wellbeing: people with a low happiness score (Persons 16+ yrs) | 2022/23 | 8.9 | 9.6 | 12.1 | 11.1 | 6.2 | 10.1 | 6.2 | 11.3 | 7.5 | 10.4 | 7.9 | 9.8 | 13.2 | 10.7 | 9.2 | 12.1 | 7.9 |
Again, this differed markedly in relation to the local survey conducted during 2019 (15.9%), and regardless of the time period of the national survey this was the case.
The percentages reporting low levels of happiness nationally and regionally both increased between 2019/20 and 2020/21, and it might be anticipated due to the COVID-19 pandemic. However, not such increase occurred in Hull which is surprising. The percentage remained relatively unchanged in Hull between 2020/21 and 2021/22, although has increased between 2021/22 and 2022/23.
Given Hull’s increased level of deprivation and the ongoing cost of living crisis, one might expect that the percentage would increase in Hull, and at a faster rate compared to nationally or regionally. This is in contrast to the percentages of people in Hull who have low satisfaction with life score and have low worthwhile score.
Compared with benchmark
Self reported wellbeing: people with a low happiness score (Persons 16+ yrs)
|
Period
|
Kingston upon Hull |
Yorkshire and the Humber region (statistical)
|
England
|
||||
|---|---|---|---|---|---|---|---|
|
Count
|
Value
|
95%
Lower CI |
95%
Upper CI |
||||
| 2011/12 | • | - | 12.4% | 10.1% | 14.6% | 11.6% | 10.7% |
| 2012/13 | • | - | 11.7% | 9.0% | 14.4% | 10.8% | 10.3% |
| 2013/14 | • | - | 13.0% | 10.6% | 15.4% | 10.7% | 9.6% |
| 2014/15 | • | - | 14.0% | 11.2% | 16.8% | 10.2% | 8.9% |
| 2015/16 | • | - | 12.4% | 9.9% | 14.9% | 9.9% | 8.8% |
| 2016/17 | • | - | 9.5% | 7.2% | 11.8% | 9.5% | 8.5% |
| 2017/18 | • | - | 8.8% | 6.5% | 11.1% | 9.1% | 8.2% |
| 2018/19 | • | - | 11.6% | 8.9% | 14.3% | 9.4% | 7.8% |
| 2019/20 | • | - | 13.2% | 10.1% | 16.2% | 9.8% | 8.8% |
| 2020/21 | • | - | 11.0% | 7.5% | 14.5% | 10.3% | 9.2% |
| 2021/22 | • | - | 11.1% | 7.5% | 14.6% | 7.9% | 8.4% |
| 2022/23 | • | - | 12.1% | 8.3% | 15.9% | 9.6% | 8.9% |
Source: Office for National Statistics
Anxiety
Almost one third of survey responders had had high levels of anxiety yesterday with the highest levels among women, younger people particularly those aged 16-24 years, people living in the most deprived areas of Hull, students, people who were not working due to unemployment or long-term illness or disability, lone parents and people aged under 65 years who lived alone.
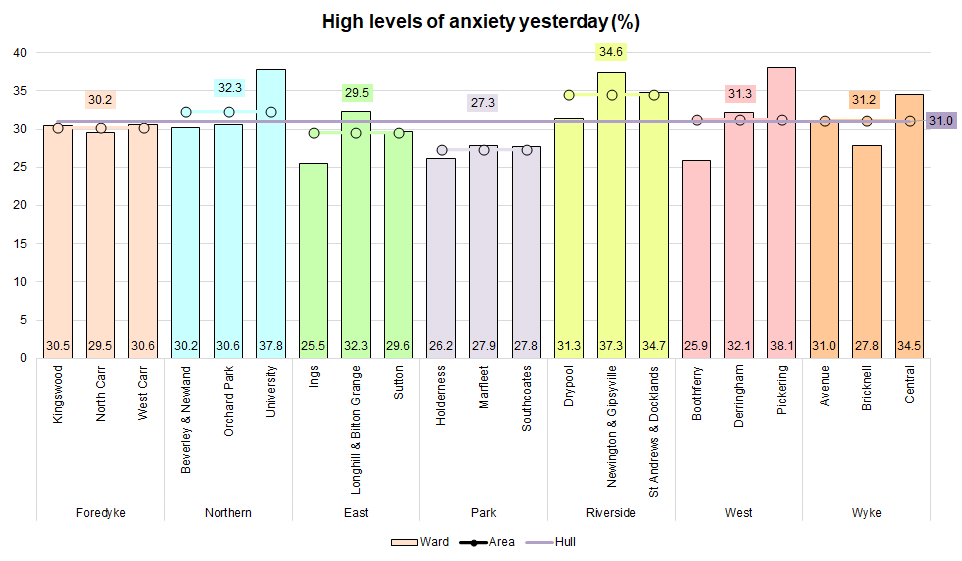
In University and Newington & Gipsyville wards, 38% of survey responders had high levels of anxiety yesterday, and it was also over two-thirds among people living in St Andrew’s & Docklands and Central wards.
In 2022/23, the percentage from the national survey was higher in Hull at 29.0% compared to England (23.3%) and second highest in the region.
Compared with benchmark
| Indicator | Period | England | Yorkshire and the Humber region (statistical) | Kingston upon Hull | East Riding of Yorkshire | North East Lincolnshire | North Lincolnshire | York | Barnsley | Doncaster | Rotherham | Sheffield | Bradford | Calderdale | Kirklees | Leeds | Wakefield | North Yorkshire Cty |
|---|---|---|---|---|---|---|---|---|---|---|---|---|---|---|---|---|---|---|
Self reported wellbeing: people with a high anxiety score (Persons 16+ yrs) | 2022/23 | 23.3 | 24.2 | 29.0 | 23.7 | 20.1 | 22.9 | 26.2 | 22.3 | 27.4 | 24.3 | 20.8 | 26.1 | 27.1 | 25.9 | 20.1 | 30.3 | 23.4 |
However, as for the other wellbeing measures, the percentage was higher in the local survey (31.0%) compared to the national survey which ranged from 18.4% in 2018/19 to 24.7% in 2020/21 with the exception of the most recent year 2022/23 where the percentage for Hull from the national survey is only just lower than the local survey.
There has been an increase nationally and across the region between 2019/20 and 2020/21 which might be expected due to the COVID-19 pandemic, but the increase in Hull was smaller. However, the percentage decreased between 2020/21 and 2021/22 for both England and the region whereas for Hull, the percentage remained relatively unchanged. Furthermore, in the last year, there has been an increase for England, the region and Hull, but the increase in Hull has been much greater.
This change in the percentage is more likely to reflect the current circumstances with the increased and continuing pressure on household finances in contrast to the measures of low satisfaction and low worthwhile mentioned above.
Compared with benchmark
Self reported wellbeing: people with a high anxiety score (Persons 16+ yrs)
|
Period
|
Kingston upon Hull |
Yorkshire and the Humber region (statistical)
|
England
|
||||
|---|---|---|---|---|---|---|---|
|
Count
|
Value
|
95%
Lower CI |
95%
Upper CI |
||||
| 2011/12 | • | - | 20.7% | 17.9% | 23.5% | 21.5% | 21.7% |
| 2012/13 | • | - | 22.4% | 18.9% | 25.8% | 21.3% | 21.0% |
| 2013/14 | • | - | 21.0% | 17.9% | 24.2% | 21.4% | 20.0% |
| 2014/15 | • | - | 21.1% | 18.0% | 24.2% | 21.3% | 19.3% |
| 2015/16 | • | - | 22.9% | 19.7% | 26.0% | 21.5% | 19.4% |
| 2016/17 | • | - | 21.5% | 18.0% | 24.9% | 21.2% | 19.9% |
| 2017/18 | • | - | 21.3% | 17.9% | 24.7% | 21.2% | 20.0% |
| 2018/19 | • | - | 18.4% | 15.3% | 21.5% | 20.6% | 19.7% |
| 2019/20 | • | - | 23.7% | 19.8% | 27.6% | 22.1% | 21.9% |
| 2020/21 | • | - | 24.7% | 19.4% | 30.0% | 24.9% | 24.1% |
| 2021/22 | • | - | 24.5% | 19.0% | 30.1% | 22.3% | 22.6% |
| 2022/23 | • | - | 29.0% | 23.4% | 34.7% | 24.2% | 23.3% |
Source: Office for National Statistics
Mental Health Index
In addition, survey respondents in Hull’s Health and Wellbeing Survey 2019 were asked five questions from the Mental Health Index to how they felt over the past four weeks in relation to nervousness, feelings of being down in the dumps, calm and peaceful, downhearted, or happy. They were asked if they felt like this all of the time, most of the time, some of the time, a little of the time or none of the time.
Between 10% and 15% felt nervous, felt so down in the dumps nothing could cheer them up or felt downhearted and low all or most of the time in the last four weeks.
Over four in ten felt calm and peaceful all or most of the time, and over half (55%) felt happy all or most of the time in the last four weeks.
| Frequency (‘…of the time’) over last four weeks | Number | All | Most | Some | A little | None |
| Have you been nervous? | 4,059 | 2.4 | 10.0 | 32.7 | 29.7 | 25.5 |
| Have you felt so down in the dumps nothing could cheer you up? | 4,051 | 2.7 | 9.1 | 22.9 | 25.7 | 39.6 |
| Have you felt calm and peaceful? | 4,017 | 5.8 | 36.1 | 29.9 | 20.5 | 7.7 |
| Have you felt downhearted and low? | 4,019 | 3.1 | 11.0 | 28.4 | 32.5 | 25.0 |
| Have you been happy? | 4,038 | 9.3 | 46.0 | 27.7 | 13.0 | 4.0 |
Lacking Companionship and Loneliness
In the local survey conducted during 2019, people were asked questions as to how often they felt a lack of companionship, left out, isolated from others, or lonely.
Overall, around one in ten stated that they often lack companionship. There was not a great deal of difference between men and women, or among the age groups although highest in those aged 16-24 followed by those aged 45-64 then those aged 65+ and lowest among those aged 25-44 years. People living in the most deprived two-fifths of areas of Hull were twice as likely to state they often lacked companionship compared to those living in the least deprived fifth of areas of Hull. There was also a significant difference in the percentages depending on working status being lowest for those working or who were looking after the home and family (both around 7%), 9% among people who were retired, 11% among students, but 19% among those who were unemployed and 27% for people who were not working due to long-term illness or disability. There was also a significant difference among people by households composition with 22% of people who lived alone who were aged under 65 years often feeling they lacked companionship compared to 14% among those who lived alone who were aged 65+ years. Lone parents also had relatively high levels of lacking companionship (13%). The percentage who often lacked companionship was lowest among people aged 65+ years who lived with another person at 5%.
Among survey responders aged under 65 years, the single person households had a higher percentage of males aged 35-64 years (42% versus 24% for all other households type where the survey responder was aged under 65 years) and females aged 55-64 years (19% versus 8% for all other households types where the survey responder was aged under 65 years). So it appears that this group could include people who are separated or divorced as well as single individuals.
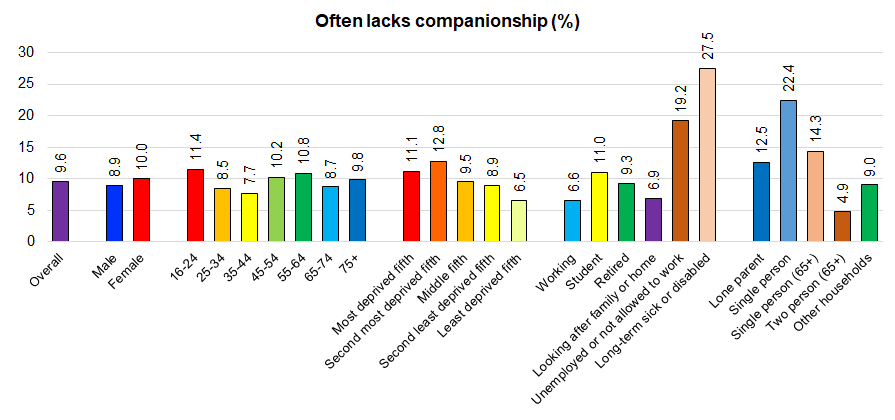
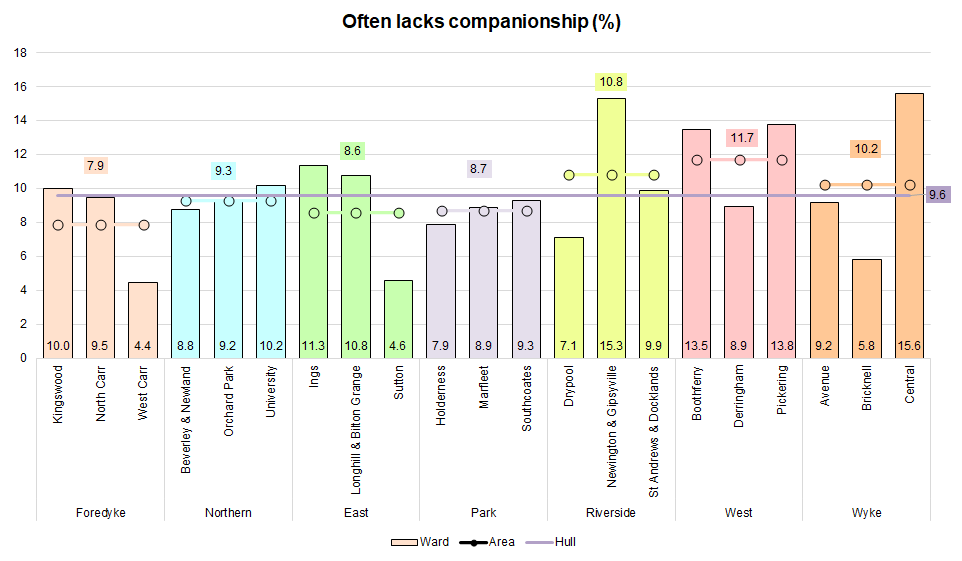
The highest percentages who often lacked companionship occurred among survey responders living in Central (16%) and Newington & Gipsyville (15%) wards.
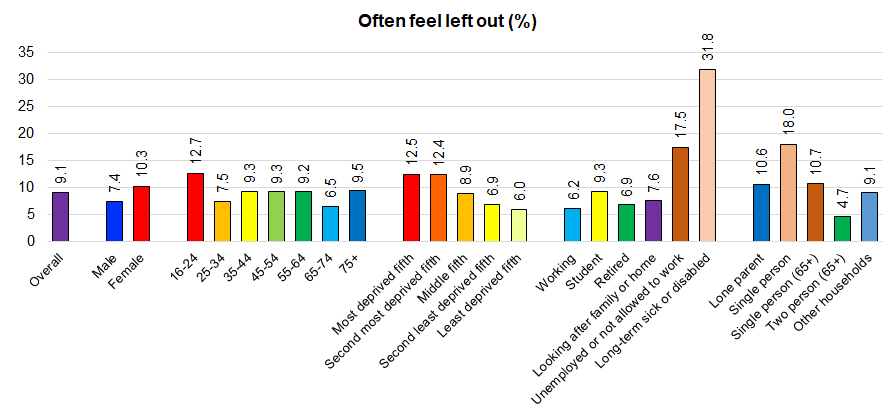
One in eleven survey responders often felt left out, but this was higher among women (10%) compared to men (7%) and considerably higher among those aged 16-24 years at 13% compared to 9% for the next highest group (aged 75+ years). There was also a strong association with deprivation with twice as many people stating they often felt left out compared to those living in the least deprived fifth of areas of Hull. Similar to lacking companionship, there was also a strong association with working status with almost one-third of people who were not working due to long-term illness and disability often feeling left out and 17% of those who were unemployed. People who were aged under 65 years and lived alone were the most likely to often feel left out at 18%.
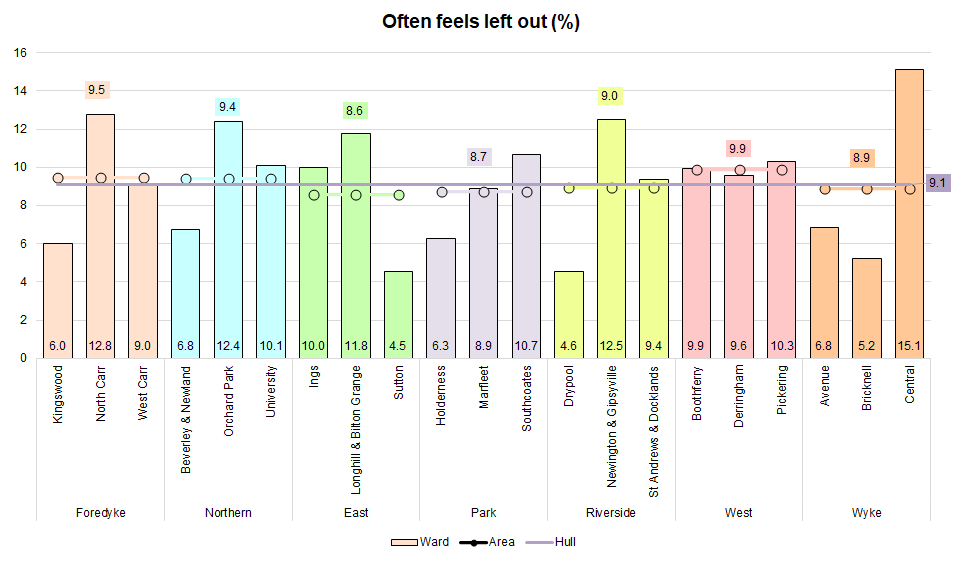
In Central ward, 15% of survey responders often felt left out, and this was also more than one in ten for survey responders living in North Carr (13%), Newington & Gipsyville (13%), Orchard Park (12%), Longhill & Bilton Grange (12%), Southcoates (11%), Pickering (10%) and University (10%).
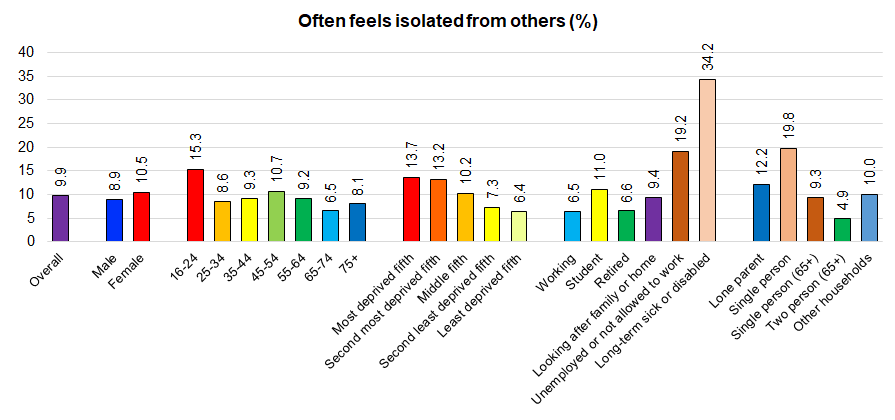
Around one in ten often felt isolated from others, and this was highest among those aged 16-24 years at 14% and lowest among those aged 65-74 years (7%). As for lacking companionship and feeling left out, people living in the most deprived two-fifths of areas of Hull were twice as likely to often feel isolated from others than those who lived in the least deprived fifth of areas of Hull. Almost one in five people who were unemployed felt isolated from others as did over one-third of people who were not working due to long-term illness and disability. One-fifth of people aged under 65 years who lived alone often felt isolated from others.
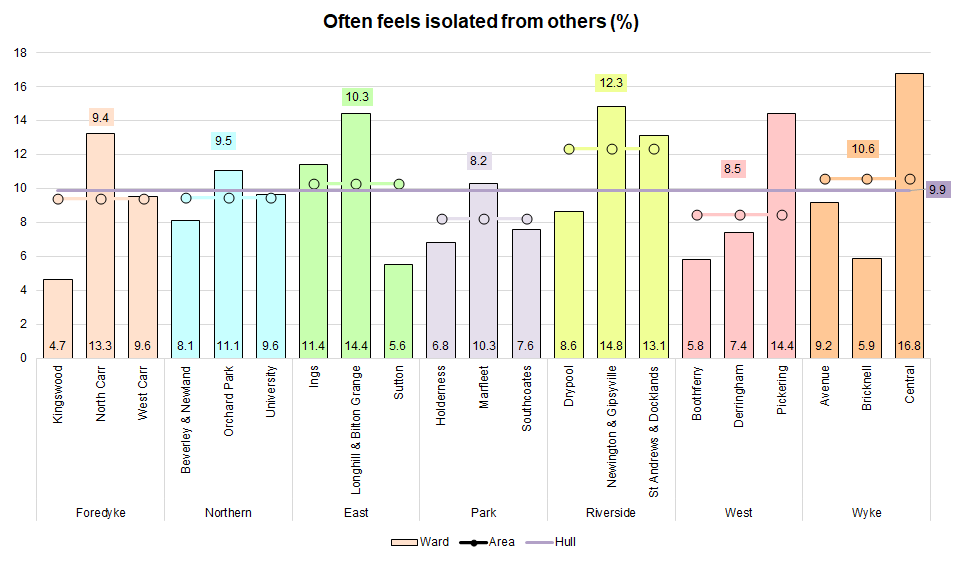
In Central ward, 17% of survey responders stated they often felt isolated from other and it was almost 15% for people living in Newington & Gipsyville, Longhill & Bilton Grange, and Pickering wards.
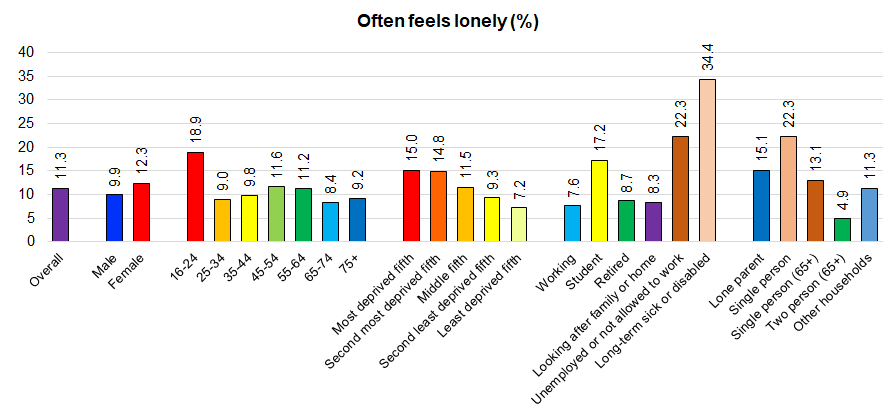
There was a similar pattern in relation to often feeling lonely although the percentages were considerably higher among those aged 16-24 years and among students.
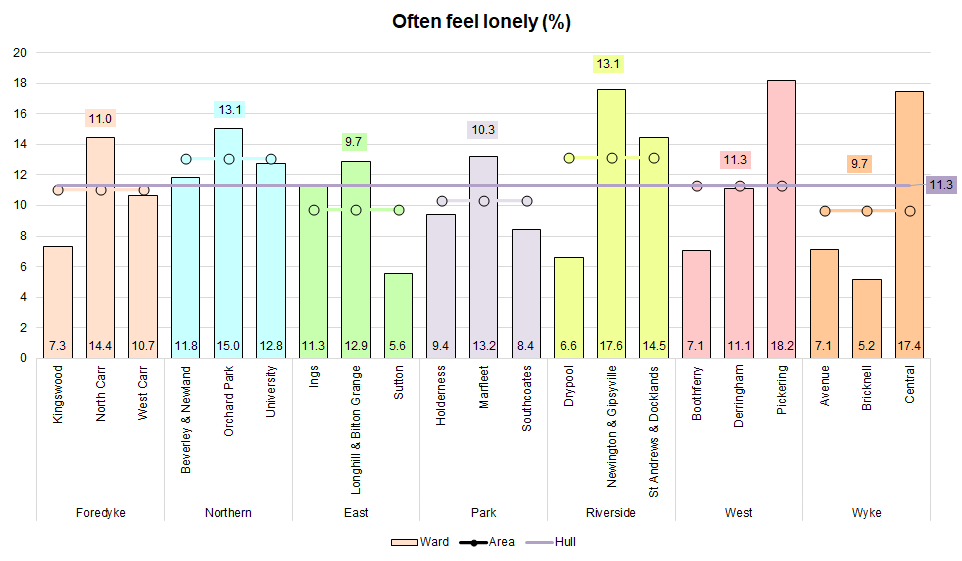
Around 18% of survey responders living in Pickering, Newington & Gipsyville and Central wards often felt lonely.
There were stark differences between different groups of people when examining the percentages who stated ‘often’ to at least one of these four questions. Overall, 18% had stated they often felt they lacked companionship, often felt left out, often felt isolated from others and/or often felt lonely. The percentage was higher among women compared to men, and considerably higher among those aged 16-24 years at 28%. More than one in five of people living in the most deprived two-fifths of areas of Hull had stated ‘often’ for at least one of the four questions which was considerably higher than the 13% among people living in the least deprived fifth of areas of Hull (although not twice as high as it had been for the four individual questions). Almost one-quarter of students, almost one-third of people who were unemployed and over half of people who were not working due to long-term illness or disability had answered ‘often’ for one or more of the four questions, as had almost one-third of people who were aged under 65 years who lived alone.
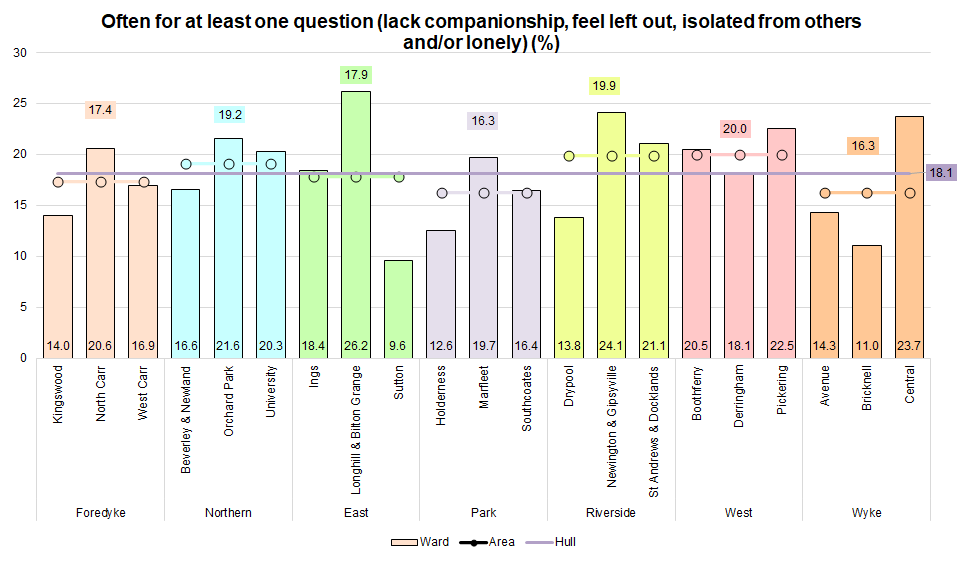
More then one-quarter of survey responders living in Longhill & Bilton Grange had stated ‘often’ for one or more of the four questions, and this was also more than one-fifth for survey responders living in Newington & Gipsyville, Central, Pickering, Orchard Park, St Andrew’s & Docklands, North Carr, Boothferry, and University wards.
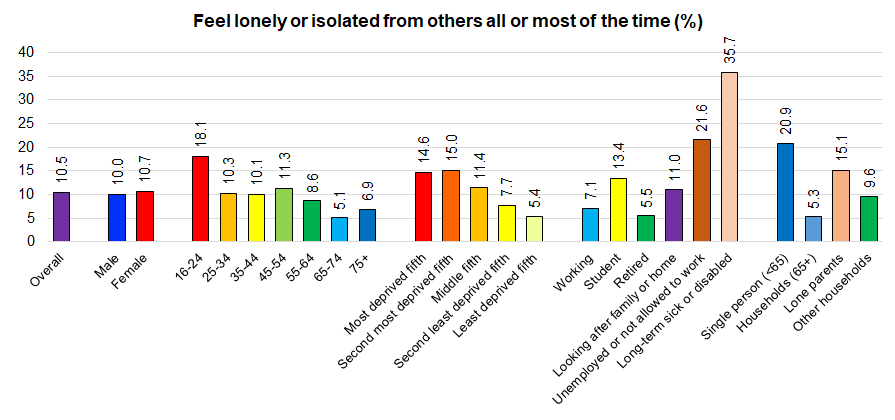
A further question in a slightly different format asked about the frequency of feeling lonely or isolated from others. Young people, people living in the most deprived areas of Hull, students, people who were not working due to unemployment or long-term illness or disability, people living alone aged under 65 years, and lone parents had the highest levels of feeling lonely or isolated from others all or most of the time.
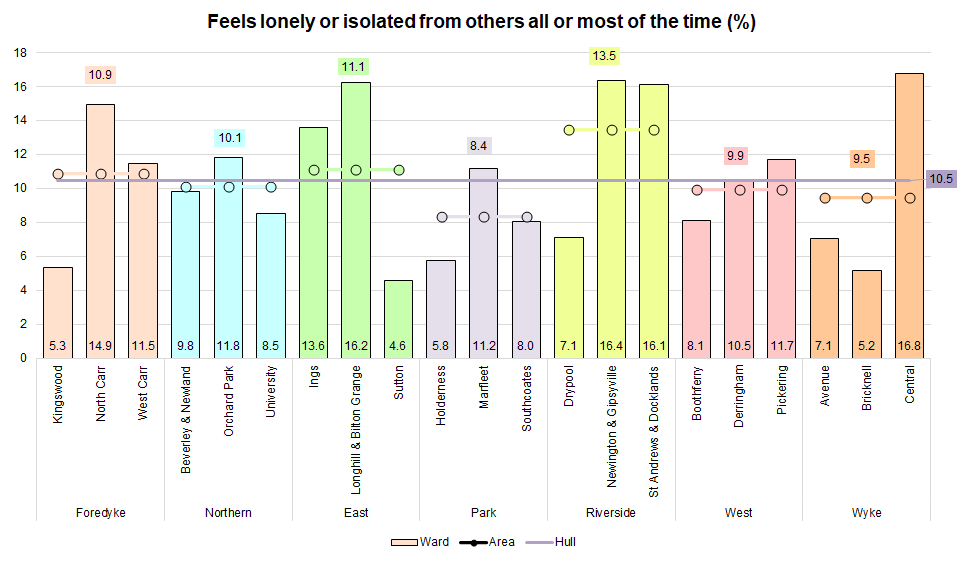
Around 16% of more of survey responders living in Central, Newington & Gipsyville, Longhill & Bilton Grange, and St Andrew’s & Docklands wards stated that they felt lonely or isolated from others all or most of the time.
The local adult Black and Minority Ethnic Health and Lifestyle Survey 2007 indicated worse mental health for failed asylum seekers, almost one-third of whom stated that they were ‘so unhappy that life is not worthwhile’ compared to 13% of those whose asylum had been granted and less than 4% for all other groups.
Treatment
Information relating to treatment for alcohol and substance use can be found within Alcohol and Drugs under Lifestyle Factors under Adults.
Hospital Admissions
Information relating to self-harm can be found within Suicide and Self-Harm under Health Factors under Adults, and information relating to hospital admissions for mental health, self-harm, alcohol and substance use can be found within Hospital Admissions under Health Factors under Children and Young People.
Projected Numbers of People with Mental Health Issues
The Projecting Adult Needs and Service Information (PANSI) and the Projecting Older People Population Information Service (POPPI) provide current estimates and future projections at local authority level of the number of people with different health needs for those aged 18-64 and 65+ years respectively.
They use estimates for the estimated prevalence from different surveys and research which have generally been derived at a national level (generally different prevalence estimates for different age groups for men and women separately). They then apply these prevalence figures to Hull’s population. For instance, if the prevalence among males in England in a specific age group is 5% and there are an estimated 500 men living in Hull in that age groups, they would estimate there were 25 men in that age group living in Hull with that condition. For many conditions, there is an increased prevalence in populations with higher levels of deprivation, and in most cases, deprivation is not taken into consideration. Thus in many cases, these estimates for Hull are likely to underestimate the numbers in Hull due to the high levels of deprivation in Hull.
Further definitions are available from www.pansi.org.uk and www.poppi.org.uk.
It is estimated that just over 30,000 people aged 18-64 years in Hull have a common mental health disorder, just under 4,000 have a borderline personality disorder, around 5,600 have an antisocial personality disorder, over 1,100 have a psychotic disorder and that almost 12,000 have two or more psychiatric disorders. The numbers are not anticipated to change much between 2020 and 2040 as the population aged 18-64 years is projected to remain relatively stable in terms of total numbers.
“Common mental disorders comprise different types of depression and anxiety, including obsessive compulsive disorders. They cause marked emotional distress and interfere with daily function, but do not usually affect insight or cognition.
Personality disorders are long-standing ingrained distortions of personality that interfere with the ability to make and sustain relationships. Antisocial personality disorder and borderline personality disorder are two types with particular public and mental health relevance.
Borderline personality disorder is characterised by high levels of personal and emotional instability associated with significant impairment.
Antisocial personality disorder is characterised by disregard and violation of the rights of others. People with antisocial personality disorder have a pattern of aggressive and irresponsible behaviour with emerges in childhood or early adolescence.
Psychotic disorders produce disturbances in thinking and perception severe enough to distort perception of reality. Psychoses can be serious and debilitating conditions.
Psychiatric comorbidity – or meeting the diagnostic criteria for two or more psychiatric disorders – is known to be associated with increased severity of symptoms, longer duration, greater functional disability and increased use of health services. Disorders include the most common mental disorders (anxiety and depression) as well as: psychotic disorder; antisocial and borderline personality disorders; eating disorder; post-traumatic stress disorder (PTSD); attention deficit hyperactivity disorder (ADHD); alcohol and drug dependency; and problem behaviours such as problem gambling and suicide attempts.
| Mental health disorder | 2020 | 2025 | 2030 | 2035 | 2040 |
| Common mental disorder | 30,914 | 30,351 | 30,137 | 30,022 | 29,763 |
| Borderline personality disorder | 3,927 | 3,856 | 3,829 | 3,814 | 3,781 |
| Antisocial personality disorder | 5,555 | 5,474 | 5,450 | 5,441 | 5,402 |
| Psychotic disorder | 1,150 | 1,131 | 1,124 | 1,120 | 1,111 |
| Two or more psychiatric disorders | 11,820 | 11,616 | 11,542 | 11,504 | 11,410 |
It is estimated that there are around 5,900 men and 12,900 women aged 18-64 years who are survivors of sexual abuse in Hull.
| Gender | 2020 | 2025 | 2030 | 2035 | 2040 |
| Males | 5,866 | 5,796 | 5,782 | 5,782 | 5,747 |
| Females | 12,880 | 12,592 | 12,464 | 12,384 | 12,256 |
| Persons | 18,746 | 18,388 | 18,246 | 18,166 | 18,003 |
The number of people aged 65+ years with depression is estimated to be around 3,400 in 2020, but anticipated to increase to over 4,200 by 2040 due to the ageing population.
| Age | 2020 | 2025 | 2030 | 2035 | 2040 |
| 65-69 | 980 | 1,073 | 1,185 | 1,118 | 1,024 |
| 70-74 | 898 | 849 | 926 | 1,048 | 989 |
| 75-79 | 595 | 778 | 734 | 822 | 922 |
| 80-84 | 509 | 500 | 670 | 642 | 726 |
| 85+ | 409 | 408 | 413 | 521 | 559 |
| Total 65+ | 3,390 | 3,607 | 3,928 | 4,151 | 4,219 |
The number of people aged 65+ years with severe depression is estimated to be just over 1,000 in 2020 but anticipated to increase to around 1,400 by 2040, again because of increasing to the number of people aged 65+ years in Hull.
| Age | 2020 | 2025 | 2030 | 2035 | 2040 |
| 65-69 | 290 | 318 | 353 | 333 | 305 |
| 70-74 | 174 | 165 | 181 | 202 | 192 |
| 75-79 | 245 | 322 | 305 | 340 | 382 |
| 80-84 | 165 | 159 | 213 | 204 | 228 |
| 85+ | 179 | 183 | 187 | 238 | 257 |
| Total 65+ | 1,054 | 1,147 | 1,238 | 1,316 | 1,364 |
Strategic Need and Service Provision
The World Health Organization state that mental health promotion involves actions that improve psychological well-being which may involve creating an environment that supports mental health. An environment that respects and protects basic civil, political, socio-economic and cultural rights is fundamental to mental health. Without the security and freedom provided by these rights, it is difficult to maintain a high level of mental health. National mental health policies should be concerned both with mental disorders and, with broader issues that promote mental health. Mental health promotion should be mainstreamed into governmental and nongovernmental policies and programmes. In addition to the health sector, it is essential to involve the education, labour, justice, transport, environment, housing, and welfare sectors.
WHO go on to state in terms of treatment and care that in the context of national efforts to develop and implement mental health policy, it is vital to not only protect and promote the mental well-being of its citizens, but also address the needs of persons with defined mental disorders. Knowledge of what to do about the escalating burden of mental disorders has improved substantially over the past decade. There is a growing body of evidence demonstrating both the efficacy and cost-effectiveness of key interventions for priority mental disorders in countries at different levels of economic development.
People with general mental health issues need to be identified early and encouraged to seek help early so that the consequences in terms of the effects on family and employment are minimised, issues are not escalated so reduce the levels of need for crisis and/or medical interventions. It should be recognised that specific groups of people may be more likely to have mental health issues due to their circumstances, such as poverty, asylum seekers, social isolation, etc. There is a need to improve and expand early help and targeted interventions to improve young people’s emotional health and wellbeing and build resilience to enable them to cope with challenging life events.
Hull’s Early Help and Prevention Strategy 2021-2025 aims to identify individuals and families with problems and brings together different services and agencies to collectively look at what support is needed and then work together to deliver the required support in an coordinated way. The framework outlines the approach to ensure that collaboration and alignment of services, and that early help may be ‘early in life or at the earliest opportunity’ which is also part of the day job, helpful, non-stigmatising, preventative, targeted and tailored. There are four thresholds of need: (i) no additional needs which is the universal response to build resilience in children and young people; (ii) additional needs involving prevention and early help; (iii) complex needs involving a targeted response of early help and interventions; and (iv) risk of significant harm which includes child protection procedures and safeguarding services.
In order to improve mental health, other non-medical approaches might be necessary such as talking therapies, helping solve practical problems that are causing stress and anxiety such as housing problems and debt, and improving social networks and support through community involvement, for example, befriending. Hull’s Connect Well social prescribing service aims to bridge a gap helping Hull’s residents access support and guidance on a range of issues, helping people feel more linked in with their communities, helping with issues such as money, benefits and housing, helping with physical or emotional difficulties, and helping get active and feeling better.
It is recognised the mental and emotional wellbeing has been detrimentally affected for many adults and children due to COVID-19 and lockdowns. Furthermore, the effect has not been felt evenly across society and the most vulnerable have generally been affected the worst, increasing the inequalities gap both between Hull and England, and within Hull. Recognition is not sufficient and increased resources need to be made available to improve mental health and emotional wellbeing particularly among those most affected.
A Mentally Healthy Hull strategy has been produced which looks at how, as a city, we can collectively boost good mental health and prevent and reduce the impact of mental health problems.
Resources
National Institute for Health and Care Excellence, Social and emotional wellbeing for children and young people: Local government briefing. www.nice.org.uk. 2013, National Institute for Health and Care Excellence: London.
World Health Organization. Mental health: strengthening our response: https://www.who.int/news-room/fact-sheets/detail/mental-health-strengthening-our-response
NHS Digital. Quality and Outcomes Framework. https://qof.digital.nhs.uk/
The Office for Health Improvement & Disparities’ Fingertips: https://fingertips.phe.org.uk/
Hull’s Health and Wellbeing Surveys
Hull’s Early Help and Prevention Strategy 2021-25. https://www.hull.gov.uk/downloads/file/1726/Hull_Early_Help_and_Prevention_Strategy_2021_25.pdf
Updates
This page was last updated / checked on 24 April 2025.
This page is due to be updated / checked in October 2025.