Index
This topic area covers statistics and information relating to physical activity among children and young people in Hull including local strategic need and service provision. Further information relating to Physical Activity Among Adults is given under Lifestyle Factors within Adults. Physical activity information has been collected within Hull’s Health and Wellbeing Surveys and full reports are available under Surveys within Tools and Resources.
Headlines
- Parents have a strong influence on young children’s physical activity levels, particularly mothers. Among older children, peers are much more important in determining physical activity levels.
- Whilst physical inactivity, together with poor diet, has an impact on obesity which is a risk factor for poor health, physical inactivity is also an independent risk factor for poor physical health, and physical activity can also improve mental health. It is estimated that physical inactivity is costing the UK around £7.4 billion a year including £0.9 billion to the NHS alone.
- A Physical Activity Needs Assessment was undertaken in Hull during 2025 which examines physical activity levels in Hull in more detail as well as provides qualitative information relating to the needs and barriers of the people of Hull in relation to physical activity.
- The levels of physical inactivity in Hull are high, and there is a strong association with deprivation. This impacts on levels of obesity in Hull which are high, as well as increasing the risk of poor physical and mental health.
- The physical activity national guidelines state that children and young people aged 5-18 years should undertake an average of at least one hour of physical activity every day.
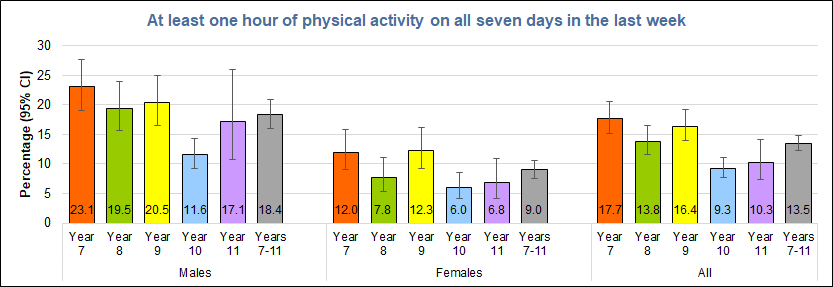
- From the local Health and Wellbeing Survey conducted among Hull secondary school students in 2024, 18% of boys and 9% of girls undertook at least one hour of physical activity on each day in the week before the survey. In general, those who were younger were also more likely to be physically active (23.1% of Year 7 boys and 12.0% of Year 7 girls compared to 17.1% of Year 11 boys and 6.8% of Year 11 girls undertaking one hour or more of physical activity on all seven days in the previous week).
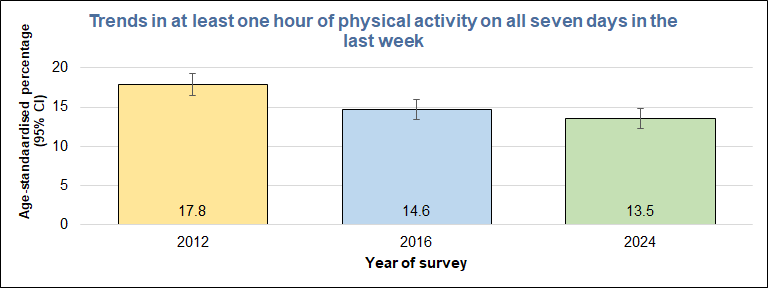
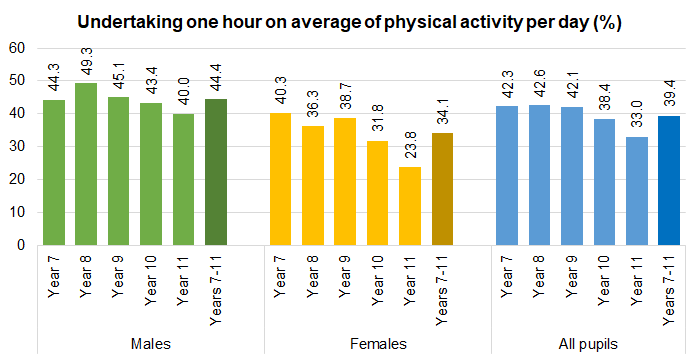
- From the earlier Health and Wellbeing Survey conducted among secondary schools in Hull during 2016, pupils were asked about the total number of hours of physical activity undertaken in the previous week. Averaging this out, 44% of boys and 34% of girls undertook at least one hour of physical activity each day based on the total weekly hours of activity averaged over seven days, but only 14.6% overall had undertaken at least one hour or more of physical activity on every day during the last week, similar to the 13.5% from the 2024 survey.
- From the Active Lives Survey – which covers both primary and secondary school-age children – the percentage who were active and fulfilled national guidelines was 50% for 2024/25 considerably higher than the local estimates. A further 23% were fairly active in that they undertook on average 30-59 minutes of physical activity per day, and 27% were less active undertaking less physical activity than this. Whilst the ages of the survey responders differ, the local survey is much larger and potentially more representative of Hull’s population than the Active Lives Survey where the number of survey responders is much smaller. Only 288 Hull children participated in the Active Lives Survey for 2024/25. This represents fewer than 1% of all children aged 5-16 years living in Hull, and it is possible that the children surveyed are not representative of all children in Hull.
The Population Affected – Why Is It Important?
Whatever a person’s age, there is good scientific evidence that being physically active can help them lead a healthier and happier life. The lack of physical activity and inactivity is a major risk factor in its own right increasing the risk of circulatory disease, diabetes, dementia, Alzheimer’s disease, stroke, and some cancers. There is also strong evidence that physical activity promotes mental wellbeing, boosting self-esteem, mood, sleep quality, and energy, as well as easing stress and anxiety.
The Office for Health Improvement & Disparities (formerly Public Health England) estimated that this lack of physical activity is costing the UK and estimated £7.4 billion a year, including £0.9 billion to the NHS alone.
Parental influence is important in young children, and the influence of peers has greater influence among older children and young adults. Thus children growing up in families who are physical active are more likely to become physically active themselves, and older children who have friends who are physical active are more likely to be physically active themselves.
The Chief Medical Officer guidelines for physical activity sets out the amount and type of activities for health benefits for different age groups from babies to older adults, stating that some physical activity is good, but more is better. It is recommended that physical activity levels should be 150 minutes every week throughout pregnancy, three hours every day from birth to five years, at least an hour a day for five to 18 year olds, 75 minutes of vigorous intensity or 150 minutes of moderate intensity physical activity for adults aged 19-64 years, and 150 minutes of at least light intensity physical activity for adults aged 65+ years.
In general, the more time spent being physically active, the greater the health benefits. However, the gains are especially significant for those currently doing the lowest levels of activity (fewer than 30 minutes per week), as the improvements in health per additional minute of physical activity will be proportionately greater.
The Hull Picture
Hull’s Physical Activity Needs Assessment 2025
A Physical Activity Needs Assessment was undertaken in Hull during 2025 which examines physical activity levels in Hull in more detail as well as provides qualitative information relating to the needs and barriers of the people of Hull in relation to physical activity.
Levels of Physical Activity and Inactivity
Local Health and Wellbeing Surveys
A Health and Wellbeing Survey was conducted among young people in secondary schools in the Spring of 2024, although the survey was shorter and did not include as many questions as earlier surveys; it did not include a question on the total number of physical activity hours over an entire week, but did ask the number of days in the last week the young person has undertaken at least one hour of physical activity. As not all secondary schools took part in the survey in 2024, the results were weighted for gender, school year (7, 8, 9 and 10-11 combined) and local deprivation fifth. To compare like-with-like, the equivalent figures from the 2012 and 2016 were also weighted using the same three factors although numbers surveyed were higher among year 11 pupils so it was possible to produced weights for all five school years (weighted by the population at the time and the Index of Multiple Deprivation local fifths at the time of the survey).
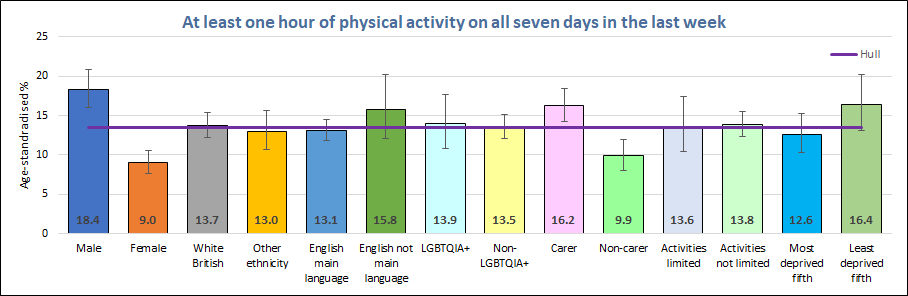
In the local Young People Health and Lifestyle Survey 2024, 18.4% of male and 9.0% of female secondary school pupils in Hull engaged in at least one hour of physical activity on each of the seven days before completing the survey. There was an association with age, with the percentage of pupils undertaking at least one hour of physical activity every day decreasing with increasing age. For each year group, more boys than girls achieved one hour or more of physical activity every day.
There has been a small decrease since the 2016 survey in the percentage of secondary school students that got at least one hour of physical activity everyday in the last week, with 13.5% overall doing so in 2024, compared with 14.6% in the 2016 survey, which itself decreased from 17.8% in the 2012 survey.
While not asked about in the 2024 survey, the previous Young People Health and Lifestyle Survey conducted in 2016 asked pupils for the total number of hours of physical activity undertaken on each day in the previous week. These were then added up and divided by seven to give the average number of hours of physical activity per day. Using this method, 44% of male and 34% of female secondary school pupils in Hull engaged in sufficient physical activity to fulfil national guidelines (at least one hour daily), with a strong association with age among female pupils with levels of physical activity decreasing with increasing age.
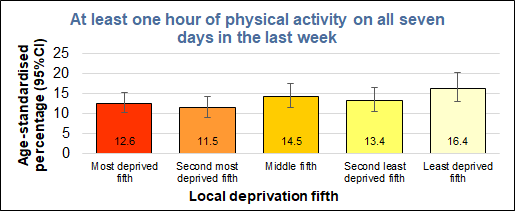
The percentage of pupils reporting that they achieved at least one hour of physical activity every day was associated with deprivation, with the percentage meeting this recommendation increasing as the level of deprivation decreased. Around one in eight pupils living in the two most deprived fifths of areas of Hull achieved one hour or more pf physical activity every day, rising to around one in six pupils living in the least deprived fifth of areas of the city.
Looking through a wider inequalities lens, apart from differences by sex and deprivation, there was little variation between subgroups apart form between cares and non-carers, with one in sex cares achieving the recommended one hour of physical activity a day, compared with just one in ten of non-carers. This difference is likely confounded by age, as younger pupils, who were more likely to achieve the ‘hour a day’ recommendation were also more likely to report being carers (around three-quarters in year 7, decreasing to 53% of boys and 37% of girls in year 11)
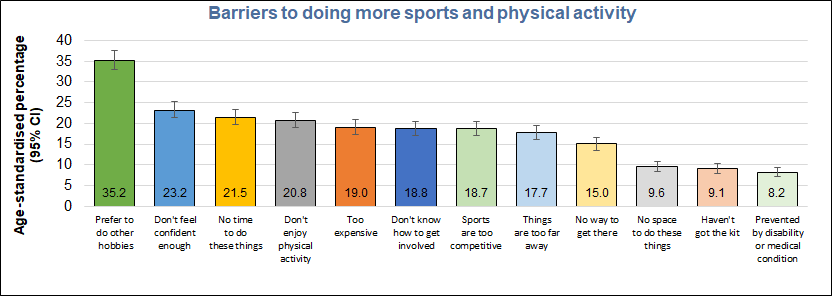
In Hull’s Health and Wellbeing Survey of Young People 2024, pupils were asked about some of the tings that might prevent them undertaking more sports and physical activities. The most common reasons given were preferring to pursue other hobbies (35%), not feeling confident enough (23%), not having the time (22%) and not enjoying physical activity (21%). Almost on in five reported that it was too expensive to take part in sports or physical activities, that they didn’t know how to get involved, or that sports or activities are too competitive. One in twelve pupils reported not being able to take part due to disability or medical conditions.
National Active Lives Survey
The national Active Lives Surveys collect information at local authority level and information is available for Hull from the 2017/18 school year, although for 2019/20 and 2020/21 the number of children is too small to be presented for Hull (when data has been presented the number of children participating is small at often 500 children or fewer).
The Active Lives Survey involves children in schools and covers children in Year 1 (aged 5-6 years) to Year 11 (aged 15-16 years) with parents completing the survey for younger children in school years 1 and 2. Schools are randomly selected to take part in the survey.
The local Young People Health and Wellbeing Surveys conducted in 2016 and 2024 report much lower levels of physical activity. Whilst some of this will be accounted for by the younger age groups (and primary school aged children generally being more physical active than secondary school aged children), it is likely that the children surveyed are not as representative of Hull’s population compared to the local surveys which have a much higher number of young people participating in the survey (around 4,000) compared to Actives Lives (which varies between 255 and 983 for 2017/18, 2018/19 and 2021/22 to 2024/25). The survey questions are different between the local survey and Actives Lives as well which will influence the findings.
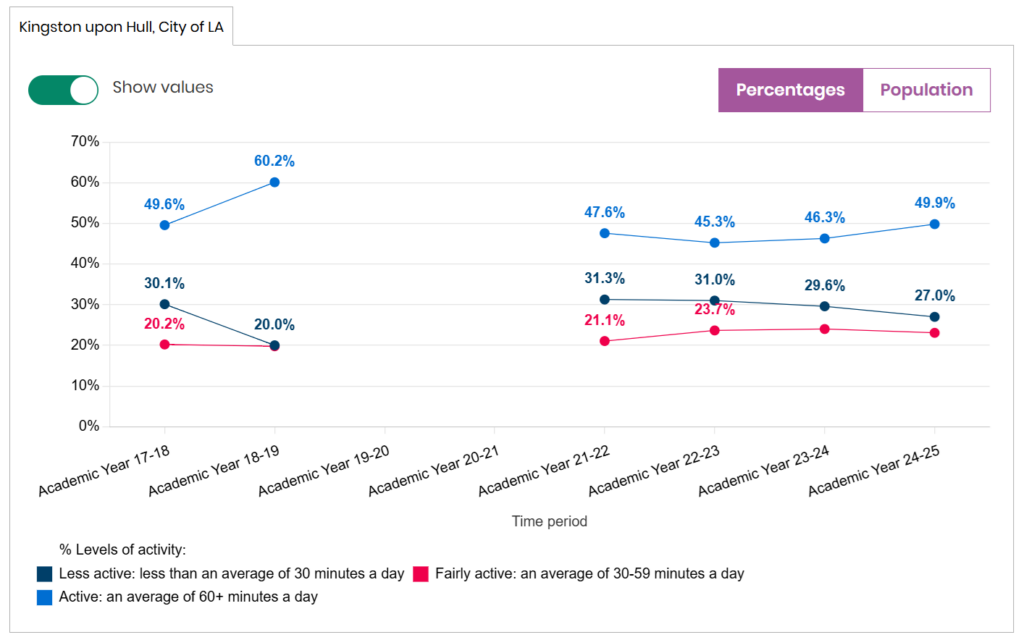
The percentage increased dramatically in Hull from 2017/18 to 2018/19 from 49.6% to 60.2%. This was because Hymers was one of the schools selected to take part in 2018/19 and their physical activity levels are much higher than most schools. There have been insufficient numbers of children participating in the Active Lives Survey in Hull for 2019/20 and 2020/21, but data has been available for the last four years. For 2024/25, 50% of young people in Hull were active and fulfilled the national physical activity guidelines of an average of an hour of physical activity per day.
The results of the Active Lives Survey are compared with the results from the local Young People Health and Wellbeing Survey in the Local Physical Activity Scorecard below.
The percentage of physically active children and young people from Active Lives is also given on the Office for Health Improvement & Disparities’ Fingertips.
The percentage of physically active children – undertaking on average at least one hour of moderate-vigorous physical activity per day across the week – in Hull is slightly higher than England and the region for 2024/25.
Compared with benchmark
| Indicator | Period | England | Yorkshire and the Humber region (statistical) | Kingston upon Hull | East Riding of Yorkshire | North East Lincolnshire | North Lincolnshire | York | North Yorkshire UA | Barnsley | Doncaster | Rotherham | Sheffield | Bradford | Calderdale | Kirklees | Leeds | Wakefield |
|---|---|---|---|---|---|---|---|---|---|---|---|---|---|---|---|---|---|---|
Percentage of physically active children and young people (Persons 5-16 yrs) | 2024/25 | 49.1 | 49.4 | 49.9 | 51.2 | 47.0 | 49.9 | 51.3 | 43.3 | 53.9 | 40.3 | 51.6 | 47.7 | 49.7 | 46.4 | 46.9 | 57.1 | 57.5 |
Fingertips illustrates the same trends as above, although data is not shown for all years as the number of young people participating in the survey in Hull was not sufficiently large.
There is considerable variation in the percentages with the figure for 2018/19 standing out as an outlier because Hymers was selected to participate in the survey and their activity levels are high. Thus the activity levels for this school year does not necessarily reflect the true situation over all schools as they are not a typical school in Hull. Furthermore, it is possible that this could occur for other schools years if one or more particular schools selected have high levels of physical activity such as undertaking the Daily Mile.
Compared with benchmark
Percentage of physically active children and young people (Persons 5-16 yrs)
|
Period
|
Kingston upon Hull |
Yorkshire and the Humber region (statistical)
|
England
|
||||
|---|---|---|---|---|---|---|---|
|
Count
|
Value
|
95%
Lower CI |
95%
Upper CI |
||||
| 2017/18 | • | - | 49.6% | 43.4% | 55.8% | 41.3% | 43.3% |
| 2018/19 | • | - | 60.2% | 54.3% | 65.8% | 45.9% | 46.8% |
| 2021/22 | • | - | 47.6% | 41.4% | 54.0% | 45.7% | 47.2% |
| 2022/23 | • | - | 45.3% | 40.8% | 49.8% | 47.5% | 47.0% |
| 2023/24 | • | - | 46.3% | 41.1% | 51.7% | 47.2% | 47.8% |
| 2024/25 | • | - | 49.9% | 43.4% | 56.4% | 49.4% | 49.1% |
Source: OHID, based on Sport England data
Local Physical Activity Scorecard
A summary of physical activity has been produced locally which summarises some of the information from the local Health and Wellbeing Surveys, the Active Lives Survey, information from Fingertips as well as information on the frequency of walking and cycling including active travel. The scorecard summarises information for both adults and children and is available below.
Understanding Sports and Leisure in Hull
The Local Government Association have a report which examines sport and leisure in Hull in relation to comparable geographical areas. It includes information on physical activity levels of adults and children from the Active Lives Survey, information on the frequency of walking and cycling as well as information on the number of sports and leisure facilities within Hull, and information on volunteering to support sports and physical activity events as well as numbers attending live sporting events.
Understanding Sports and Leisure in Hull
Strategic Need and Service Provision
In October 2014, The Office for Health Improvement & Disparities (formerly Public Health England) published the national physical activity framework ‘Everybody Active, Every Day’ identifies four areas of local and national action: (i) Active Society – change the social norm to make physical activity the expectation; (ii) Moving Professionals – develop expertise and leadership within professionals and volunteers; (iii) Active Environments – create environments to support active lives; and (iv) Healthy at Work – identify and upscale successful programs nationwide.
Five years on, The Office for Health Improvement & Disparities commissioned an independent review of the framework. The review had three key objectives: (1) to assess progress towards the implementation of the Everybody Active Every Day through research with professionals at national and local level; (2) to review progress of implementation of Everybody Active Every Day through evidence-based practice; and (3) to co-produce strategic actions to accelerate the scale and impact of Everybody Active Every Day over the next five years (collaboratively with national and local stakeholders).
The Everybody Active, Every Day: Five Years On published in August 2021, noted that there had been progress in that there was an increased prominence of physical activity, improvements in active environments, and other improvements, but also noted that there were challenges with limited and uneven resource (human and financial) allocation as well as lack of time required to develop strong partnerships that are pivotal to joint commissioning. The review identified opportunities which include integration of physical activity in strategies and policies, guidance on collaboration and partnership working, understanding available resources for the scale of the challenge, achieving an active society, developing active environments, mobilising professionals, and moving at scale.
As mentioned above, there are physical activity guidelines in place, and the more time spent being physically active the greater the health benefits. The gains are the highest among those currently doing the lowest levels of activity as the improvements in health per additional minute of physical activity will be proportionately greater.
In order to help people to fulfil the physical activity guidelines and increase their physical activity, it is necessary to work together to create an environment that promotes physical activity and active transport in everyday settings for all ages, and ensure people understand the benefit of positive life choices and know how to access information and seek early support to change.
Hull’s Towards an Active Hull Partnership has developed a 10 year physical activity strategy: ‘Towards an Active Hull’ with the overarching aim to move 10,000 inactive adults to be active to bring Hull in line to national levels of activity, reduce levels of inactive children and lessen inequalities. The four strategic pillars for action identified in the strategy are: Active Design, Active Recreation, Sports and Volunteering, and Active Travel. There is also an emphasis on social marketing to encourage people to ‘just make small steps to make big changes’.
Resources
Chief Medical Officers guidelines for physical activity: https://assets.publishing.service.gov.uk/government/uploads/system/uploads/attachment_data/file/832868/uk-chief-medical-officers-physical-activity-guidelines.pdf
Local Health and Wellbeing Surveys
Sport England. Active Lives. https://activelives.sportengland.org/
Hull’s Towards an Active Hull: https://www.hcandl.co.uk/sites/hcandl/files/media/Towards%20An%20Active%20Hull.pdf
Get Hull Active: www.gethullactive.co.uk
The Office for Health Improvement & Disparities (formerly Public Health England). Everybody Active, Every Day: Framework for Physical Activity. https://www.gov.uk/government/publications/everybody-active-every-day-a-framework-to-embed-physical-activity-into-daily-life
The Office for Health Improvement & Disparities (formerly Public Health England). Everybody Active, Every Day: Five Years On. https://www.gov.uk/government/publications/everybody-active-every-day-5-years-on/everybody-active-every-day-5-years-on
Updates
This page was last updated / checked on 17 April 2026.
This page is due to be updated / checked in September 2026.