Output Areas (OAs), Middle layer Super Output Areas (MSOAs) and Lower layer Super Output Areas (LSOAs) are all geographical areas originally derived for the presentation of the Census data in 2001, but have subsequently been used as geographical areas for other indicators such as the Index of Multiple Deprivation which is available at LSOA geographical level.
The most commonly used area among these three geographical areas are LSOAs, although the MSOAs are sometimes used as an alternative to wards as they are a similar size (if ward data is not available) and some data has been represented at OA level from the 2021 Census. However, due to small numbers it is rare to have measures available at OA level.
OAs, MSOAs and LSOAs were first derived nationally following the 2001 Census. Prior to that, information was often presented at ward level, but the population size within wards across the entire country varied dramatically, which meant that the statistical certainty differed considerably, and in some cases, numbers were too small to present the information for some of England’s smallest wards.
LSOAs are made up from MSOAs, and MSOAs are made up from OAs.
Output Areas (OAs) are the lowest level of geographical area. They are made up from between 40 and 250 households, and usually a resident population between 100 and 625 people, although there are exceptions, for instance, where there is a large prison.
The LSOAs are made up from groups of OAs, generally four or five.
The boundaries of each LSOA were created so that each LSOA in England has a minimum population of 1,000 residents and an average of 1,500 residents, and generally between 400 and 1,200 households.
The MSOAs are made up from groups of LSOAs, generally four or five.
MLSOAs comprise between 2,000 and 6,000 households and usually have a resident population between 5,000 and 15,000 with MLSOAs fitting within local authorities.
Following each Census, it has been necessary to change the boundaries of OAs, MSOAs and LSOAs because of changes in the local population. In most cases, each of these will stay the same. Further details are presented below in relation to the changes for LSOAs.
Count of different geographical areas in 2001
Output areas: England – 165,665 and Hull – 834.
Lower layer super output areas: England – 32,482 and Hull – 163.
Middle layer super output areas: England – 6,781 and Hull – 32.
Count of different geographical areas in 2011
Output areas: England – 171,372 and Hull – 853.
Lower layer super output areas: England – 32,844 and Hull – 166.
Middle layer super output areas: England – 6,791 and Hull – 32.
Count of different geographical areas in 2021
Output areas: England – 178,605 and Hull – 881.
Lower layer super output areas: England – 33,755 and Hull – 168.
Middle layer super output areas: England – 6,856 and Hull – 33.
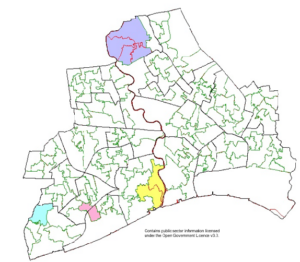
There were 163 LSOAs in Hull created following the 2001 Census. Due to population changes between 2001 and 2011, the LOSA boundaries were changed slightly following the 2011 Census. There were 166 LSOAs in Hull after the 2011 Census. By far the majority of LSOAs remained the same in 2011 as for 2001. One LSOA was split into four LSOAs in 2011 (in the Kingwood area of Hull where there had been new housing developments and an increase in the population shown by purple in the map below with E01012831 split into E01033105 to E01033108), another LSOA was split into two LSOAs in 2011 (within the old Myton ward within the city centre shown in yellow on the map E01012853 split into E01033104 and E01033109), and two LSOAs from 2001 were combined into a single LSOA in 2011 (one was in the old Newington ward and the other was in the old St Andrew’s ward shown in pink on the map E01012861 and E01012890 combined into E01033110). Another LSOA had its code changed (shown in blue on the map; E01012885 changed to E01032595) but it was unclear why this was changed as the boundary appeared identical for both 2001 and 2011. The change where two LSOAs were merged into a single LSOA in 2011 meant that the LSOAs were no longer coterminous with the wards and thus could not be combined to create Hull’s electoral ward. However, following the ward boundaries in May 2018, none of the LSOAs boundaries in Hull were coterminous with the ward boundaries.

Furthermore, due to population changes from the 2021 Census, the LSOAs in Hull have changed again.
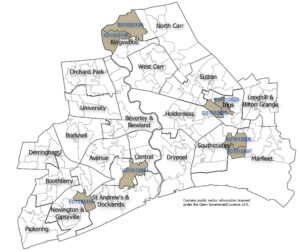
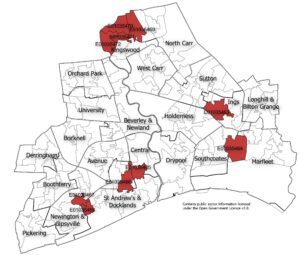
Of the 166 LSOAs in 2011, 158 (95%) remained unchanged in 2021, two pairs of LSOAs were merged into two new LSOAs (so four of the 166 LSOAs changed to two new LSOAs in 2021), and a further four LSOAs were split into two LSOAs each (so four of the 166 LSOAs were split into eight new LSOAs in 2021). This meant that the total number of LSOAs in Hull based on the 2021 Census changed from 166 to 168.
The following 2011 LSOAs have been changed in 2021.

E01012823 and E01012826 merged to become E01035463.
E01012895 and E01012897 merged to become E01035464.
E01012851 was split into E01035465 and E01035466.
E01033110 was split into E01035467 and E01035468.
E01033108 was split into E01035469 and E01035470.
E01033106 was split into E01035471 and E01035472.
The 2021 LSOAs are shown below with the changes in 2021 highlighted.

So between 2001 and 2021, 153 LSOAs have remained the same in 2001, 2011 and 2021.
Another LSOA in 2001 (E01012885) had its code changed (to E0103295) with no obvious change to the LSOA shape or boundary.
E01012853 (south east of the river Hull) was split into E01033104 and E01033109 following the 2011 Census but these two LSOAs remained unchanged following the 2021 Census.
Both E01012823 and E01012826 (in Ings ward) were unchanged following the 2011 Census but were merged to form E101035463 following the 2021 Census.
Both E01012895 and E01012897 (in Southcoates and Marfleet wards) were unchanged following the 2011 Census but were merged to form E101035464 following the 2021 Census.
E01012851 (Central and St Andrew’s & Docklands wards) was unchanged following the 2011 Census but was split into E101035464 and E101035465 following the 2021 Census.
E01012831 (in Kingswood) was split into E01033105, E01033106, E01033107 and E01033108 following the 2011 Census, and then E01033106 was then split into E101035471 and E101035472 following the 2021 Census and E01033108 was then split into E101035469 and E101035470 following the 2021 Census (E01033105 and E01033107 remained unchanged between the 2011 and 2021 Censuses). So the original LSOA in 2001 has now been split into six LSOAs in 2021.
E01012861 and E01012890 (in St Andrew’s & Docklands and Newington & Gipsyville wards) were merged into E0103310 following the 2011 Census, but has now been split again into E101035467 and E101035468 following the 2021 Census, although the boundaries for the new LSOAs are not quite the same as they were in 2001.
Also see Index of Multiple Deprivation.