Output Areas (OAs), Middle layer Super Output Areas (MSOAs) and Lower layer Super Output Areas (LSOAs) are all geographical areas originally derived for the presentation of the Census data in 2001, but have subsequently been used as geographical areas for other indicators such as the Index of Multiple Deprivation which is available at LSOA geographical level.
The most commonly used area among these three geographical areas are LSOAs, although the MSOAs are sometimes used as an alternative to wards as they are a similar size (if ward data is not available) and some data has been represented at OA level from the 2021 Census. However, due to small numbers it is rare to have measures available at OA level.
OAs, MSOAs and LSOAs were first derived nationally following the 2001 Census. Prior to that, information was often presented at ward level, but the population size within wards across the entire country varied dramatically, which meant that the statistical certainty differed considerably, and in some cases, numbers were too small to present the information for some of England’s smallest wards.
LSOAs are made up from MSOAs, and MSOAs are made up from OAs.
Output Areas (OAs) are the lowest level of geographical area. They are made up from between 40 and 250 households, and usually a resident population between 100 and 625 people, although there are exceptions, for instance, where there is a large prison.
The LSOAs are made up from groups of OAs, generally four or five.
The boundaries of each LSOA were created so that each LSOA in England has a minimum population of 1,000 residents and an average of 1,500 residents, and generally between 400 and 1,200 households.
The MSOAs are made up from groups of LSOAs, generally four or five.
MLSOAs comprise between 2,000 and 6,000 households and usually have a resident population between 5,000 and 15,000 with MLSOAs fitting within local authorities.
Following each Census, it has been necessary to change the boundaries of OAs, MSOAs and LSOAs because of changes in the local population. In most cases, each of these will stay the same. For instance, in Hull between 2001 and 2011, 158 of Hull’s 163 LSOAs remained the same, one existing LSOA was split into four new LSOAs (in Kingswood where there had been housing developments), another LSOA was split into two new LSOAs, and two LSOAs were merged into a new LSOA, and there was another change noted where the specifics of the change were not obvious (boundary appeared to be the same). Between 2011 and 2021, 158 of Hull’s 166 LSOAs remained the same, two pairs of existing LSOA were combined into two new LSOAs, and four existing LSOAs were each split into two new LSOAs so eight new LSOAs in total.
Count of different geographical areas in 2001
Output areas: England – 165,665 and Hull – 834.
Lower layer super output areas: England – 32,482 and Hull – 163.
Middle layer super output areas: England – 6,781 and Hull – 32.
Count of different geographical areas in 2011
Output areas: England – 171,372 and Hull – 853.
Lower layer super output areas: England – 32,844 and Hull – 166.
Middle layer super output areas: England – 6,791 and Hull – 32.
Count of different geographical areas in 2021
Output areas: England – 178,605 and Hull – 881.
Lower layer super output areas: England – 33,755 and Hull – 168.
Middle layer super output areas: England – 6,856 and Hull – 33.
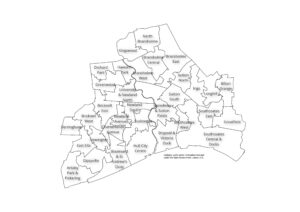
Names were assigned to MLSOAs following the 2021 Census, and as a result they are more useful.
Further information about the changes in the LSOAs following the Censuses is given on Lower Layer Super Output Areas.
Also see Index of Multiple Deprivation.