Index
This topic area covers statistics and information relating to climate change in Hull including local strategic need and service provision. Further information is also available about Hull and the environment can be found under Geographical Area within Place, and under Air Pollution within Health and Wellbeing Influences.
Headlines
- Humans interact with the environment constantly. These interactions affect quality of life, years of healthy life lived, and health disparities.
- The Intergovernmental Panel on Climate Change state that we are currently experiencing the greatest change in the natural environment in human history.
- Climate change impacts on biodiversity strips with a decline of global biodiversity of 69% between 1970 and 2018.
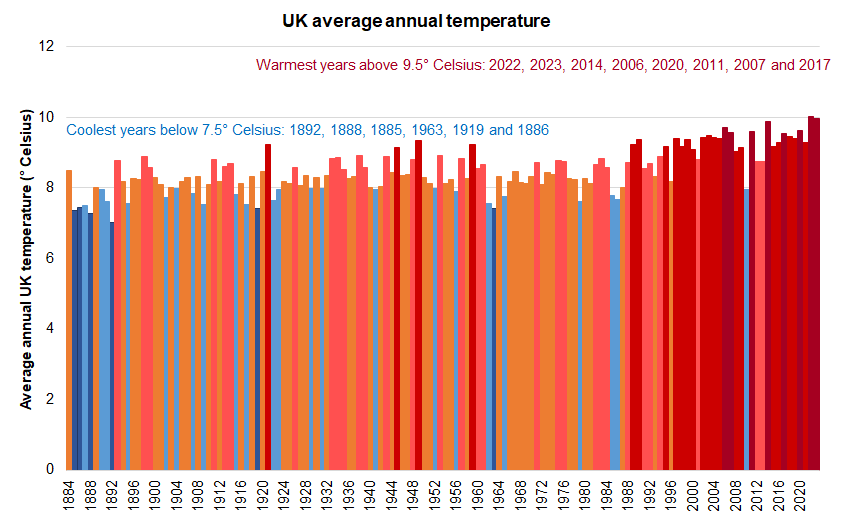
- The hottest eight years since records began in 1884 were between 2006 and 2023 and all had an average annual temperature above 9.5° Celsius with the latest two years 2022 and 2023 having the highest average annual temperature of 10.0° Celsius. In contrast, four of the six coolest years were between 1885 and 1892 which all had an average annual temperature of below 7.5° Celsius (as did 1919 and 1963).
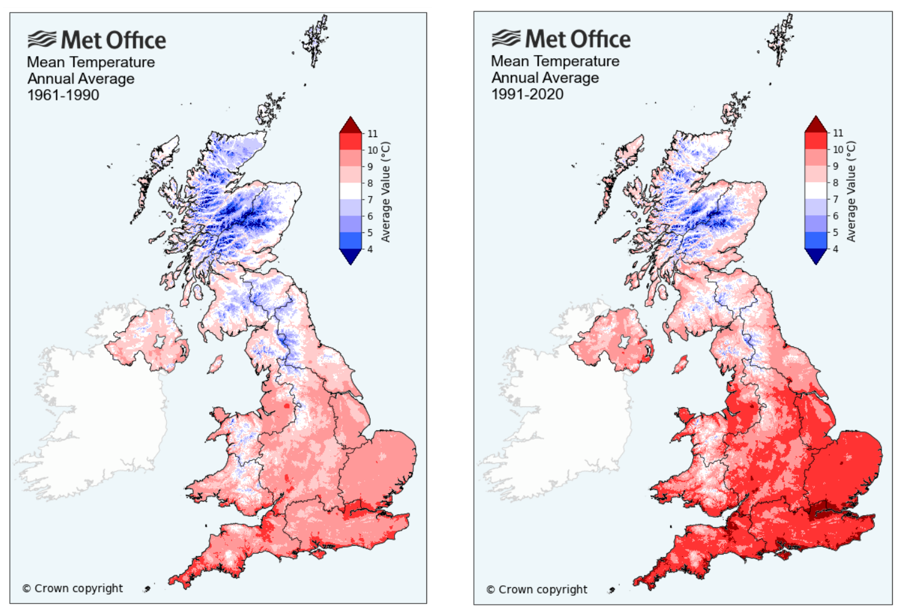
- The average annual temperature in Hull has increased from between 9° Celsius and 10° Celsius for the period 1961 to 1990 to between 10° Celsius and 11° Celsius for the period 1991 to 2020.
- There were severe flooding events in Hull in 2007 and 2013 which had a significant impact on individuals and communities. The likelihood of these flooding events has increased because of global heating.
- In July 2019, Hull had a new temperature record of 35° Celsius, and only three years later in July 2022, this was broken with a new record of 37° Celsius. These high temperature records are the consequences of only a 1.1° Celsius increase in global temperatures.
- The number of climate risks requiring adaptation are increasing with significant impacts on people’s health, life support systems, and health and care providers.
- There is the potential for measures introduced to resolve one problem to be detrimental to other strategies, so full consultation and engagement between the different areas and an assessment of the impacts of any council actions is essential to ensure strategies complement each other.
The Population Affected – Why Is It Important?
Climate change is the greatest threat faced by humanity and the natural world. Emissions from the burning of fossil fuels has seen global temperature increase by 1.1° Celsius since the industrial revolution and under current “business as usual” we are on course for a global temperature increase of 3° Celsius.
The Paris Agreement set a global target to limit global heating to not more than 2° Celsius with an aim to keep temperature increase to no more than 1.5° Celsius. The science indicates that at global temperatures of 2° Celsius there is an increased danger of feedback loops in the natural world and the risk of cascade effects. For example, the melting of permafrost releases methane into the atmosphere which drives further temperature increase which drives increased permafrost melting.
The science of climate change clearly shows that actions by humans are driving these changes through a robust evidence contained in a number of reports published in 2021 and 2022 by the United Nations.
As a result of this the world is passing a number of tipping points for planetary boundaries covering air quality, climate change, water, and natural environment and other life supporting systems provided by earth. More information on planetary boundaries can be found here https://www.stockholmresilience.org/research/planetary-boundaries.html
The Intergovernmental Panel on Climate Change state that we are currently experiencing the greatest change in the natural environment in human history. The threat of climate change as a result of the increase of greenhouse gases by human activity is pushing known planetary boundaries in areas such as species loss, air quality, natural resources and extreme weather events. The increasing global population expansion and dietary change to a more meat-based diet is putting pressure on agriculture and land use.
Climate change impacts on biodiversity (trees, plants, birds, animals, oceans, fish, corals, etc) with a decline of global biodiversity of 69% between 1970 and 2018.
Climate change is affecting the frequency and intensity of extreme weather events such as flooding, storms, forest and moorland fires and heat waves. These weather events impact the most vulnerable in society for example the young and old, and this with lifelong limiting illness, and those most economically disadvantaged, who are least able to recover from such events. We are seeing increased global carbon dioxide concentrations each year and even during the global COVID-19 pandemic concentrations in 2020 set a new record. This is driving increased temperature and new records being set for warmest years on record. Current scientific evidence published by the United Nations Intergovernmental Panel on Climate Change show that the climate impacts we are experiencing are a result of only a 1.1° Celsius rise in global temperatures and the Paris Agreement has set a target to restrict global heating to well below 2° Celsius with an ambition to restrict to 1.5° Celsius.
In the 140 years from 1884 to 2023 inclusive, there has been a clear increase in the average annual temperature in the UK as a result of human activity.
There have been six years where the average annual temperature was below 7.5° Celsius. The lowest three temperatures all occurred in the 1800s (7.02° Celsius in 1892, 7.28° Celsius in 1888 and 7.36° Celsius in 1885) with the most recent year being 1963 which had the fourth coolest temperature since records began in 1884 (7.42° Celsius in 1919 and 7.45° Celsius in 1886 complete the list of the lowest six average annual UK temperatures).
There have been eight years where the average annual temperature was greater than 9.5° Celsius. All eight of these years were between 2006 and 2023 with the latest two years 2022 and 2023 having the highest average annual temperatures recorded at 10.03° Celsius for 2022 and 9.97° Celsius for 2023 (9.88° Celsius in 2014, 9.70° Celsius in 2006, 9.62° Celsius in 2020, 9.61° Celsius in 2011, 9.56° Celsius in 2007 and 9.53° Celsius in 2017 were the remaining years where the temperature was above 9.5° Celsius).
The averages of the average annual temperatures were:
- 7.95° Celsius for the 16 years from 1884 to 1899 (range 7.02° Celsius to 8.88° Celsius)
- 8.29° Celsius for the 50 years from 1900 to 1949 (range 7.42° Celsius to 9.34° Celsius)
- 8.43° Celsius for the 50 years from 1950 to 1999 (range 7.41° Celsius to 9.41° Celsius)
- 9.32° Celsius for the 24 years from 2000 to 2023 (range 7.94° Celsius to 10.03° Celsius).
The average annual temperature varies throughout the UK depending on numerous factors such as latitude (the average annual temperature ranges from about 7° Celsius in the Shetlands to over 11° Celsius in Cornwall and the Channel Islands), altitude (decrease of about 0.5° Celsius for each 100 metres increase in altitude), and to some extent proximity to the coast. There is also a seasonal variation (over the year) and diurnal variation (over the day).
The average annual temperatures have increased between 1961-1990 and 1991-2020 for most areas of the UK.
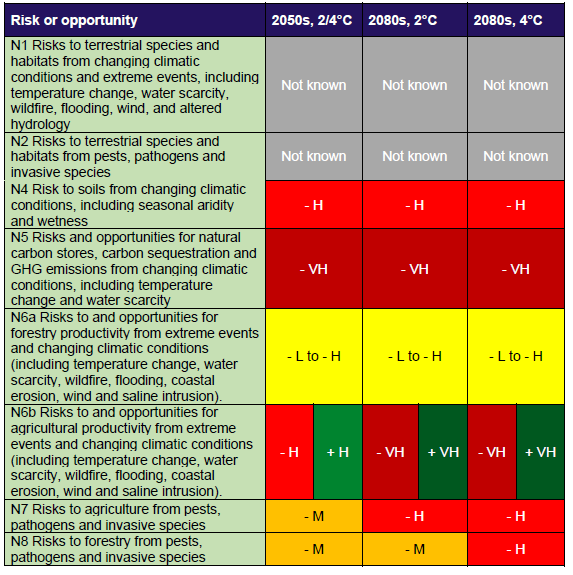
The UK Climate Change Act 2008 (2050 Target Amendment) Order 2019 has set a target to reduce carbon emissions by 100% by 2050 (from a 1990 baseline). In 2020 the UK’s average surface temperature had risen by 1.2° Celsius. Further, in 2022 the Government published the latest Climate Change Risk Assessment following advice from the Committee on Climate Change. The risk assessment looked at the impact of the risks and opportunities from climate change under a 2° Celsius and 4° Celsius global heating scenario.
This identified sixty-one risks and opportunities with thirty-four of them requiring more action within the next five years, to 2027. Twenty-two where more research was needed, four where we needed to sustain current action and three where we needed to maintain a watching brief.
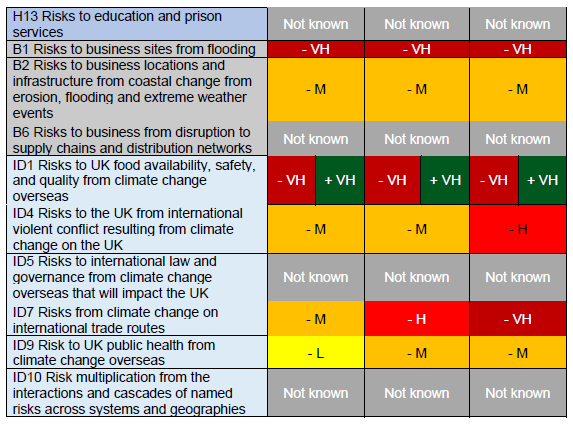
Many of the risks either have a direct effect on people’s health such as heatwaves, flooding and increase in pathogens, or an indirect impact through affecting health functions to operate such as flooding of roads, buildings etc. The table below from the UK Climate Change Risk Assessment 2022 provides a good starting point to understand the risks over the rest of the century.
The potential costs and damages (economic costs or forgone opportunities) are denoted with a negative sign, and possible opportunities are denoted with a positive sign. Where uncertainty exists over the category, the range has been indicated. For some of the risks and opportunities, there are both potential costs and benefits. The risks and benefits are denoted as follows:
- Very High (VH) is over £1 billion per year.
- High (H) is over hundreds of millions of pounds per year.
- Medium (M) is over tens of millions of pounds per year.
- Low (L) is less than ten million pounds per year.
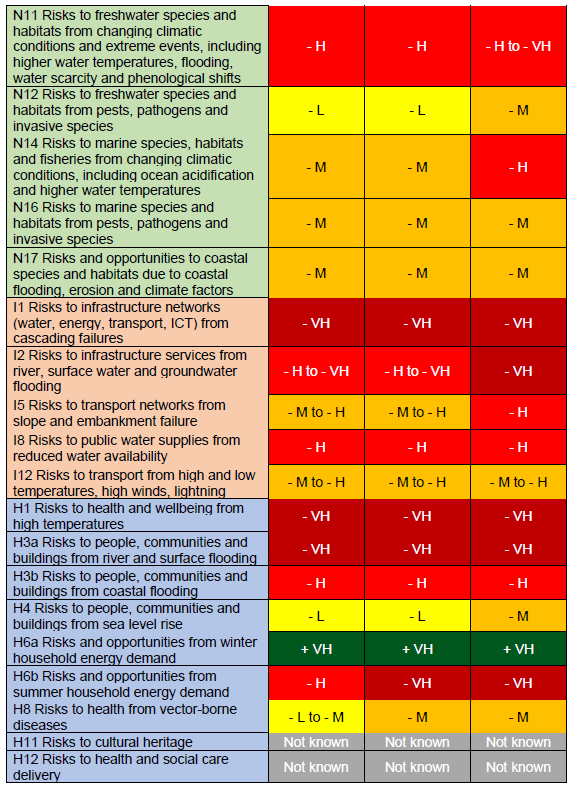
There is therefore an imperative to increase the scale and pace of action to reduce carbon emissions, and to significantly increase adaptation activity to prepare for the inevitable consequences of climate change.
A third National Adaptation Programme was published in July 2023 that provides the action plan to address the risks identified, and covers the period 2024-2028. This risk assessment and Programme provide a sound strategic focus for joint strategic needs action.
In 2014, the Joseph Rowntree Foundation produced an evidence review of climate change and social justice. Their review identified five different forms of climate injustice in the UK context, and found that lower income and other disadvantaged groups contributed the least to causing climate change yet they were the most likely to be negatively impacted by its effects. They were also less able to participate in decision-making around policy responses.
In 2018, a revised webtool developed by the Joseph Rowntree Foundation and University of Manchester, Climate Just, demonstrated that residents who were already vulnerable due to age, long term life limiting illnesses and poverty are least able to be resilient to the impacts of climate change and are more adversely affected than the average resident.
The Hull Picture
The city of Hull has experienced several extreme weather events over the last twenty years that have put increased pressure on public health services. The floods in 2007 affected significant parts of the city with some families not being able to return to their homes for up to two years. The tidal surge in December 2013 closed the A63 and the Transpennine rail line, and the snow and ice winters in 2010 and 2011 affected roads with some impassable for weeks and increased the number of people suffering falls. Hull has experienced significant heatwaves in July 2019 with a new temperature record of 35° Celsius and only three years later in July 2022 this was broken with a new record of 37° Celsius. These heatwaves are likely to increase in intensity and frequency as the century progresses with increased pressure on health and care services.
The impacts of climate change will disproportionately affect the most vulnerable and therefore put increased pressure on public health and health services in Hull.
In response to the increasing impacts of climate change and global heating Hull City Council declared a Climate Emergency in 2019 and produced the Hull 2030 Carbon Neutral Strategy in 2020 setting out the key challenges faced and an initial suite of actions.
In 2022 the Council agreed a 2045 net zero target for the city and a 2040 net zero target for the Council to bring the cities and Council’s ambitions in line with national climate action. This followed extensive research with the Carbon Trust to establish a science-based target for the city under a high ambition reduction scenario. This includes several carbon pathways for key sectors to meet the net zero target.
Strategic Need and Service Provision
Since January 2013, Hull City Council has held the highest Green Accreditation for its environmental management system, Investors in the Environment and undertaken work to reduce its carbon emissions in line with its corporate targets.
There is a need to better understand the extent of climate risk to public health and the wider health services in the City. The development of effective climate adaptation for services and facilities would ensure that they are more resilient to extreme weather events and therefore reduce the emergency impact on public health services.
It is necessary to work with partners to reduce the impact of extreme weather events and wider emergency events and seek assurance of preparedness, response and recovery when events happen. To create a natural and physical environment that is resilient to climate change.
The cost of extreme weather events to public health services is not well understood and there is a need to better understand the financial and human impacts so that this can support timely and effective climate adaptation investment. The experience of the significant flooding events have shaped how we build homes, support vulnerable residents and business and undertake resilience work at the city and community level. We have a greater understanding of how we interact with our environment and the key role it plays in improving public health as well as how it can affect people’s life chances. We also have a greater understanding and working relationship across service providers in how our actions impact each other and how through greater project integration we can build a whole system approach to the challenges.
Resources
Climate Change Explained. https://assets.publishing.service.gov.uk/government/uploads/system/uploads/attachment_data/file/1163722/climate-change-explained.pdf
The Paris Agreement. United Nations, Climate Change. https://unfccc.int/process-and-meetings/the-paris-agreement/the-paris-agreement
Climate Action. United Nations. https://www.un.org/en/climatechange/reports
Average annual temperatures in the UK. Met Office, 1884 to 2023. https://www.metoffice.gov.uk/pub/data/weather/uk/climate/datasets/Tmean/date/UK.txt
UK climate averages. Average maps. Met Office, 1961-1990 and 1991-2020. https://www.metoffice.gov.uk/research/climate/maps-and-data/uk-climate-averages/gcxdqnhwn
Climate change impacts on biodiversity strips. https://biodiversitystripes.info/global/
UK Climate Change Risk Assessment 2022. UK Government. https://www.gov.uk/government/publications/uk-climate-change-risk-assessment-2022
Independent Assessment of UK Climate Risk. Climate Change Committee, 2021. https://www.theccc.org.uk/publication/independent-assessment-of-uk-climate-risk/
Climate change: second national adaptation programme (2018 to 2023). UK Government, 2018. https://www.gov.uk/government/publications/climate-change-second-national-adaptation-programme-2018-to-2023
Climate change: Atmospheric Carbon Dioxide. https://www.climate.gov/news-features/understanding-climate/climate-change-atmospheric-carbon-dioxide#:~:text=October%207%2C%202021-,Highlights,2020%3A%20412.5%20parts%20per%20million
2021 Tied for 6th Warmest Year in Continued Trend, NASA Analysis Shows. Global Climate Change, 2022. https://climate.nasa.gov/news/3140/2021-tied-for-6th-warmest-year-in-continued-trend-nasa-analysis-shows/
What is climate change? Met Office. https://www.metoffice.gov.uk/weather/climate-change/what-is-climate-change
The Climate Change Act 2008 (2050 Target Amendment) Order 2019. https://www.legislation.gov.uk/uksi/2019/1056/contents/made
Intergovernmental Panel on Climate Change. Climate Change 2023: Synthesis Report – Summary for Policymakers. https://www.ipcc.ch/report/ar6/syr/downloads/report/IPCC_AR6_SYR_SPM.pdf
Climate Change 2021: The Physical Science Basis. Intergovernmental Panel on Climate Change. https://www.ipcc.ch/report/ar6/wg1/downloads/report/IPCC_AR6_WGI_Full_Report.pdf
Climate change and social justice: an evidence review. Joseph Rowntree Foundation, 2014. https://www.jrf.org.uk/climate-change-and-social-justice-an-evidence-review
Climate Just. Climate UK, Joseph Rowntree Foundation, Environmental Agency, University of Manchester, 2018.
National Adaptation Programme 2023. HM Government https://www.gov.uk/government/publications/third-national-adaptation-programme-nap3
Updates
This page was last updated / checked on 16 September 2025.
This page is due to be updated / checked in September 2026.