Index
This topic area covers statistics and information relating to causes of death in Hull including local strategic need and service provision. This page covers overall mortality, and whilst a key aim of this topic page is to compare the different causes of mortality, detailed information on mortality from specific diseases are covered elsewhere mainly within Health Factors under Adults and within Mental Ill Health under Vulnerable Groups, and under Stillbirths and Infant Mortality under Pregnancy, Infants and Early Years within Children and Young People. Further information on where people die (hospital, care home, at home, etc) can be found under Palliative and End of Life Care under Health Factors under Adults. Further information relating to mortality as a result of alcohol consumption, drugs and smoking can be found within Lifestyle Factors under Adults. Further information relating to the causes of death where there is an excess number of deaths in Hull which contribute to the reduced life expectancy in Hull when compared to England and to the reduced life expectancy in the most deprived areas of Hull compared to the least deprived areas of Hull can be found within Life Expectancy and Healthy Life Expectancy under Population.
This page contains information from the Office for Health Improvement & Disparities’ Fingertips. Information is taken ‘live’ from the site so uses the latest available data from Fingertips and displays it on this page. As a result, some comments on this page may relate to an earlier period of time until this page is next updated (see review dates at the end of this page).
Summary Infographic
Headlines
- There were 41 stillbirths in Hull during 2022-24 which gave a rate of 4.4 per 1,000 stillbirths and live births which was slightly higher than England at 3.9 stillbirths per 1,000 stillbirths and live births.
- There were 37 infant deaths (under one year of age) registered in Hull over the three year period 2022-24, and the rate of 4.0 per 1,000 live births was similar to England (4.2 deaths per 1,000 live births).
- The mortality rate among children aged 1-17 years in Hull (11.5 deaths per 100,000 population) was comparable to England (11.6) but lower than the region (14.3). There were an average of seven deaths among children aged 1-17 years per year registered between 2022 and 2024 in Hull.
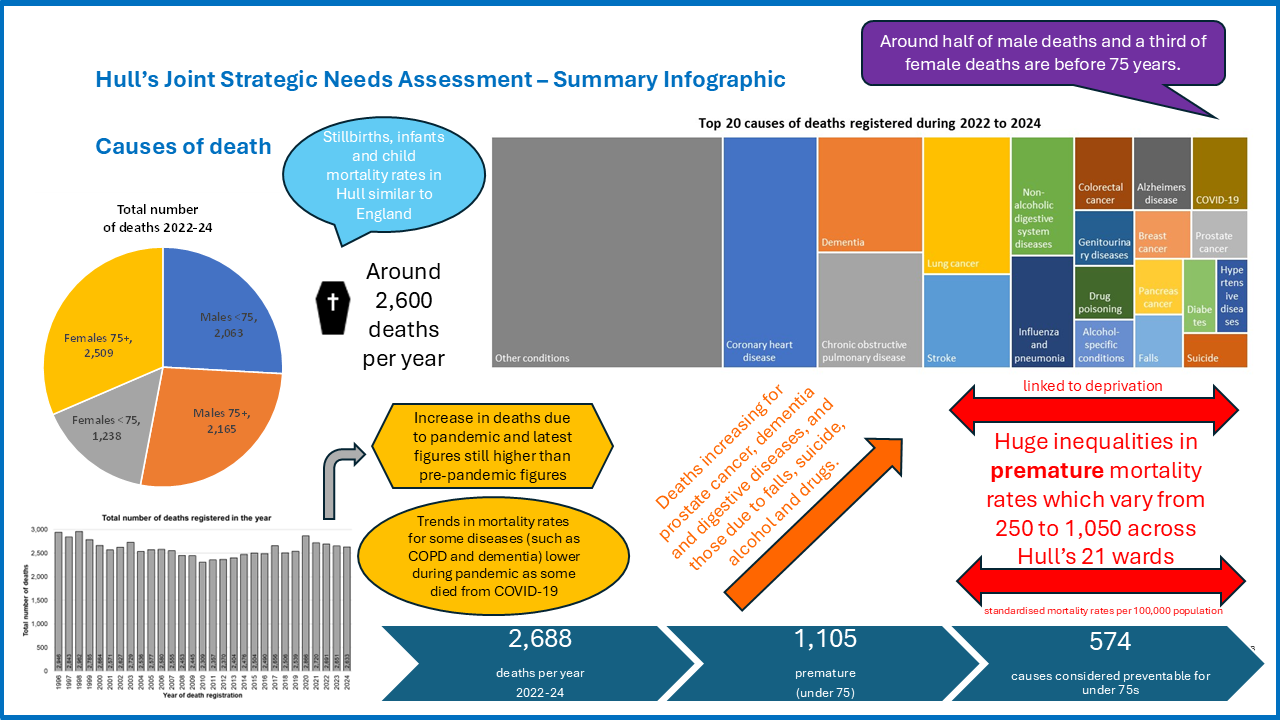
- During 2022-24, there were 7,976 deaths were registered among Hull residents with 2,064 among men under 75 years, 2,165 among men aged 75+ years, 1,238 among women under 75 years and 2,509 among women aged 75+ years.
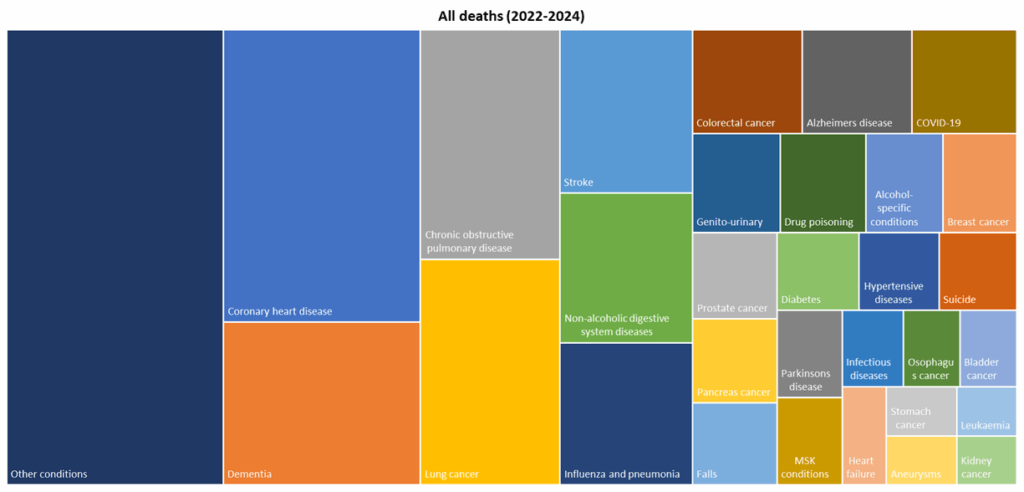
- The main causes of death of deaths that were registered during 2022-24 were cancers (26.5%) with lung cancer accounting for just over one-quarter of these deaths (6.9% of all deaths), cardiovascular disease (25.0%) with half of these deaths (12.5% of all deaths) from coronary heart disease. Respiratory disease accounted for one in seven deaths (13.5%) with more than half of these due to bronchitis, emphysema and chronic obstructive pulmonary disease (7.0% of all deaths). Dementia and Alzheimer’s disease accounted for almost one in ten deaths (9.5%). External causes accounted for one in eighteen deaths (5.6%). COVID-19 accounted for 2.4% of all deaths registered during 2022-24 (but had accounted for 14.5% of all deaths – one in seven – between the 27 March 2021 (first death from COVID-19) and the end of 2021).
- Among people aged under 75 years, coronary heart disease, lung cancer, chronic obstructive pulmonary disease, non-alcoholic digestive diseases and drug poisoning accounted for the highest number of deaths registered during 2022-24. Among those aged 75+ years, dementia, coronary heart disease, chronic obstructive pulmonary disease, lung cancer and stroke accounted for the highest number of deaths.
- Deaths from the following causes appear to have decreased over time: stomach cancer, lung cancer, epilepsy, stroke, aortic aneurysm, and asthma.
- Deaths from the following causes appear to have increased over time: pancreas cancer, prostate cancer, diabetes, dementia, Parkinson’s disease, Alzheimer’s disease, non-alcoholic digestive diseases, deaths caused by falls, suicide and undetermined injury, alcohol-specific deaths and drug poisoning.
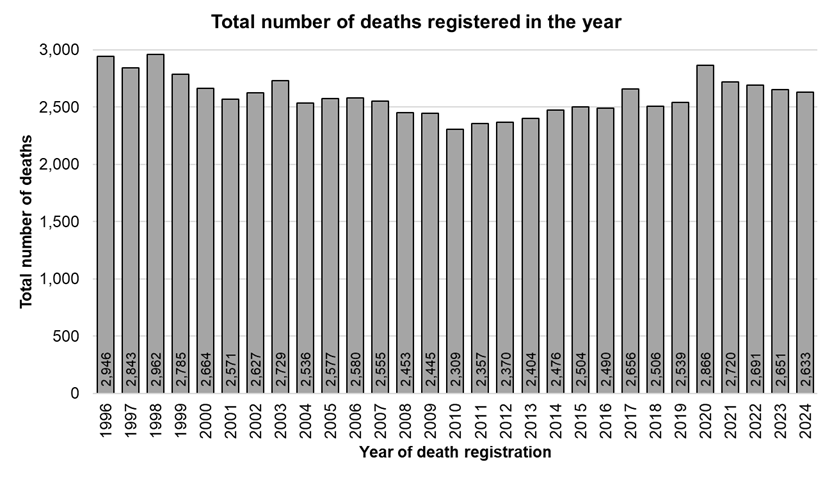
- There had been just over 2,500 deaths each year that were registered during 2018 and 2019 prior to the COVID-19 pandemic, but the number of deaths registered during 2020 increased to 2,866 for Hull residents. The numbers decreased to 2,720 for 2021, to 2,691 for 2022, to 2,651 for 2023 and to 2,633 for 2024, but are still higher than prior to the pandemic.
- The impact of the pandemic on the mortality rates was more noticeable among men compared to women. Furthermore, the causes of death also differed slightly between 2017-19 and subsequently. In some cases, it would appear that the vulnerable and frail who were the most likely to die, died of COVID-19 rather than existing medical conditions such as cancer, dementia, coronary heart disease, heart failure, stroke, chronic obstructive pulmonary disease, and chronic kidney disease. Mortality rate appeared particularly high for people with dementia as the number of people who had dementia as the underlying cause or as a secondary cause of death was higher.
- The premature (under 75) age-standardised mortality rate was very high in Hull with 505 deaths per 100,000 population registered during 2022-24 compared to 338 per 100,000 population for England. The rate in Hull was the third highest out of the 294 lower-tier local authorities in England. The mortality rate from premature deaths considered to be preventable was also very high in Hull being the fourth highest among lower-tier local authorities in England.
- A higher percentage of male premature deaths were preventable compared to females (52% versus 42%). A total of 1,603 premature deaths were from causes considered to be preventable (1,1078 men and 524 women).
- There was large variability in mortality rates among the different geographical areas across Hull whether this was defined on the basis of wards or deprivation.
- For deaths registered during the 2022-2024, the under 75 year directly standardised mortality rate ranges from 262 to 838 per 100,000 population across Hull’s 21 electoral wards. The wards with the highest levels of deprivation had the highest mortality rates. People living in the most deprived fifth of areas of Hull have a premature mortality rate of 715 per 100,000 population compared to 271 per 100,000 population for people living in the least deprived fifth of areas of Hull.
The Population Affected – Why Is It Important?
Because everybody dies, it is common to examine and compare rates for premature mortality which is defined as dying before the age of 75 years. It is also possible to examine mortality rates from premature deaths which are considered preventable such as deaths from suicide and accidents, liver disease from excessive alcohol, lung cancer deaths caused by smoking, etc. Mortality rates have generally been decreasing, but it is important to examine rates from specific causes and for specific groups to determine if rates are falling equally fast for all causes and different groups, and are falling to the same degree as England and comparator areas. However, in practice, it is necessary for the rate in Hull to fall at a faster rate than England to reduce the inequalities gap.
Years of life lost (YLL) measures the number of years of life lost for each person who dies prematurely (before the age of 75 years). It can be used to examine different causes contributing to the total YLL for all persons dying or the average YLL for each person who dies, by cause of death.
Analysis of deaths and mortality rates involve analysing the data contained on death certificates. For the majority of these analyses, the time period relates to the time period in which the death was registered rather than when the death occurred. More timely mortality information can be presented if date of registration is used to define the time period as there can be considerable delay (up to a year or more) for some deaths which require further investigation and/or a coroner’s inquest. Deaths can only be registered once the cause of death is known or has undergone investigation. This means that deaths from specific causes such as drug poisoning or possible suicide can have relatively long delays in death registration, and the majority of these deaths occur at younger ages compared to other deaths. All analyses on this page are based on date of registration unless otherwise specified.
On the whole the number of deaths that occurred in a specified year will be similar to the number of deaths registered during that same year. Some deaths will occur in one year, but registered in the next year. In most cases, the numbers will balance out so that the total numbers registered in a specific year and which occurred in a specific year will be similar. However, this is not always the case, and if there are increased delays with local coroner investigations for some reasons such as staff illness or vacancies then it is possible that the numbers do not balance out as well. It is also possible that the increased number of deaths during the COVID-19 pandemic and the winter of 2020/21 increased the length of the registration process for some deaths which result in more deaths which had occurred in 2020 being registered in 2021 compared to other years.
The majority of the information below examining the cause of death are presented based on the underlying cause of death. However, on the death certificate contributory or secondary causes of death can be added. For instance, if died from flu but was frail from heart failure then flu would likely be recorded as the underlying cause of death but heart failure would be mentioned as a contributory cause of death. Relatively few people die from diabetes directly but die from other causes such as cardiovascular disease which results from diabetes. So sometimes for certain conditions, the mortality rates are presented below based on deaths ‘involving’ a specific condition where the condition is either the underlying cause or a secondary or contributory cause of death (i.e. the condition is mentioned on the death certificate).
The total number of deaths increased substantially during the COVID-19 pandemic with a relatively high number of deaths from COVID-19. However, in some cases, the mortality from other medical conditions and diseases decreased during this period of time due to ‘competing causes of death’. For instance, the total number of deaths involving cancer, diabetes, obesity and dementia or Alzheimer’s disease were all higher during 2020 and 2021 compared to 2018 and 2019 with more deaths with that cause listed as a contributory or secondary cause due to some dying from COVID-19 (i.e. fewer having those causes listed as their underlying cause of death).
The majority of mortality rates are given as directly standardised mortality rates standardised to the European Standard Population, and presented as the number of deaths per 100,000 population.
The Hull Picture
Stillbirths, Infant Mortality and Deaths Among Children
The rate of stillbirths in Hull was 4.4 per 1,000 live births and stillbirths over the three year period during 2022-24 and the rate was slightly higher than England (3.9 stillbirths per 1,000 live births and stillbirths).
For deaths registered during 2022-24, the infant mortality rate (deaths registered under one year of age) in Hull was 4.0 per 1,000 live births which was similar to England (4.2 deaths per 1,000 live births).
Compared with benchmark
| Indicator | Period | England | Yorkshire and the Humber region (statistical) | Kingston upon Hull | East Riding of Yorkshire | North East Lincolnshire | North Lincolnshire | York | North Yorkshire UA | Barnsley | Doncaster | Rotherham | Sheffield | Bradford | Calderdale | Kirklees | Leeds | Wakefield |
|---|---|---|---|---|---|---|---|---|---|---|---|---|---|---|---|---|---|---|
Stillbirth rate (Persons 0 yrs) | 2022 - 24 | 3.9 | 3.9 | 4.4 | 1.7 | 3.0 | 3.3 | 2.6 | 3.1 | 3.7 | 4.0 | 4.0 | 4.4 | 5.7 | 4.3 | 4.0 | 3.5 | 3.9 |
Infant mortality rate (Persons <1 yr) | 2022 - 24 | 4.2 | 5.1 | 4.0 | 3.1 | 2.7 | 6.6 | 3.7 | 3.7 | 3.7 | 5.0 | 3.9 | 5.7 | 7.2 | 3.3 | 6.6 | 5.2 | 5.5 |
Since 2012-14, the rate of stillbirths has been higher in Hull than England, and it was statistically significantly higher for the three year periods from 2013-15 to 2015-17. However, the stillbirth rate has decreased in Hull since then and at a faster rate than the decrease observed nationally, so the rate in Hull had been lower than England for the last two years, although it has crept up higher than England again for 2022-24.
There were 41 stillbirths in Hull during 2022-24 giving an average of 13.7 per year.
Compared with benchmark
Stillbirth rate (Persons 0 yrs)
|
Period
|
Kingston upon Hull |
Yorkshire and the Humber region (statistical)
|
England
|
||||
|---|---|---|---|---|---|---|---|
|
Count
|
Value
|
95%
Lower CI |
95%
Upper CI |
||||
| 2001 - 03 | • | 40 | 4.6 | 3.3 | 6.3 | 5.7 | 5.6 |
| 2002 - 04 | • | 53 | 5.9 | 4.4 | 7.7 | 6.1 | 5.7 |
| 2003 - 05 | • | 54 | 5.7 | 4.3 | 7.5 | 6.2 | 5.6 |
| 2004 - 06 | • | 63 | 6.3 | 4.9 | 8.1 | 6.0 | 5.5 |
| 2005 - 07 | • | 51 | 5.0 | 3.7 | 6.6 | 5.8 | 5.3 |
| 2006 - 08 | • | 56 | 5.2 | 3.9 | 6.8 | 5.6 | 5.2 |
| 2007 - 09 | • | 61 | 5.7 | 4.3 | 7.3 | 5.6 | 5.1 |
| 2008 - 10 | • | 67 | 6.1 | 4.7 | 7.7 | 5.6 | 5.1 |
| 2009 - 11 | • | 59 | 5.3 | 4.0 | 6.8 | 5.6 | 5.2 |
| 2010 - 12 | • | 49 | 4.3 | 3.2 | 5.6 | 5.4 | 5.0 |
| 2011 - 13 | • | 54 | 4.7 | 3.6 | 6.2 | 5.3 | 4.9 |
| 2012 - 14 | • | 65 | 5.8 | 4.5 | 7.4 | 5.1 | 4.7 |
| 2013 - 15 | • | 74 | 6.8 | 5.3 | 8.5 | 4.9 | 4.6 |
| 2014 - 16 | • | 73 | 6.8 | 5.3 | 8.5 | 4.9 | 4.5 |
| 2015 - 17 | • | 62 | 5.8 | 4.5 | 7.5 | 4.6 | 4.3 |
| 2016 - 18 | • | 55 | 5.3 | 4.0 | 6.9 | 4.5 | 4.2 |
| 2017 - 19 | • | 48 | 4.8 | 3.6 | 6.4 | 4.1 | 4.0 |
| 2018 - 20 | • | 45 | 4.7 | 3.4 | 6.2 | 4.0 | 3.9 |
| 2019 - 21 | • | 38 | 4.0 | 2.9 | 5.5 | 4.1 | 3.9 |
| 2020 - 22 | • | 33 | 3.5 | 2.4 | 5.0 | 4.1 | 3.9 |
| 2021 - 23 | • | 36 | 3.9 | 2.7 | 5.3 | 4.1 | 4.0 |
| 2022 - 24 | • | 41 | 4.4 | 3.2 | 6.0 | 3.9 | 3.9 |
Source: OHID, based on Office for National Statistics data
The infant mortality rate in Hull has been reasonably comparable to England over the last couple of decades, although there has been year-on-year variability. Since 2015-17, the infant mortality rate was been consistently higher than England, although for the entire period 2001-03 to 2021-23, the rate in Hull has not been statistically significantly different than the rate in England. In 2022-24 the infant mortality rate in hull fell below the rate for England for the first time since 2014-16.
Compared with benchmark
Infant mortality rate (Persons <1 yr)
|
Period
|
Kingston upon Hull |
Yorkshire and the Humber region (statistical)
|
England
|
||||
|---|---|---|---|---|---|---|---|
|
Count
|
Value
|
95%
Lower CI |
95%
Upper CI |
||||
| 2001 - 03 | • | 43 | 5.0 | 3.6 | 6.7 | 5.9 | 5.4 |
| 2002 - 04 | • | 43 | 4.8 | 3.5 | 6.5 | 5.9 | 5.2 |
| 2003 - 05 | • | 46 | 4.9 | 3.6 | 6.5 | 5.8 | 5.1 |
| 2004 - 06 | • | 53 | 5.3 | 4.0 | 7.0 | 5.8 | 5.0 |
| 2005 - 07 | • | 50 | 4.9 | 3.6 | 6.5 | 5.8 | 4.9 |
| 2006 - 08 | • | 54 | 5.1 | 3.8 | 6.6 | 5.6 | 4.8 |
| 2007 - 09 | • | 53 | 4.9 | 3.7 | 6.5 | 5.5 | 4.7 |
| 2008 - 10 | • | 61 | 5.5 | 4.2 | 7.1 | 5.4 | 4.6 |
| 2009 - 11 | • | 56 | 5.0 | 3.8 | 6.5 | 5.2 | 4.4 |
| 2010 - 12 | • | 47 | 4.1 | 3.0 | 5.5 | 4.8 | 4.3 |
| 2011 - 13 | • | 42 | 3.7 | 2.7 | 5.0 | 4.5 | 4.1 |
| 2012 - 14 | • | 43 | 3.9 | 2.8 | 5.2 | 4.2 | 4.0 |
| 2013 - 15 | • | 44 | 4.1 | 3.0 | 5.5 | 4.3 | 3.9 |
| 2014 - 16 | • | 40 | 3.8 | 2.7 | 5.1 | 4.1 | 3.9 |
| 2015 - 17 | • | 50 | 4.7 | 3.5 | 6.2 | 4.1 | 3.9 |
| 2016 - 18 | • | 47 | 4.6 | 3.4 | 6.1 | 4.0 | 3.9 |
| 2017 - 19 | • | 50 | 5.0 | 3.7 | 6.7 | 4.2 | 3.9 |
| 2018 - 20 | • | 40 | 4.2 | 3.0 | 5.7 | 4.2 | 3.9 |
| 2019 - 21 | • | 45 | 4.8 | 3.5 | 6.4 | 4.4 | 3.9 |
| 2020 - 22 | • | 39 | 4.2 | 3.0 | 5.7 | 4.6 | 3.9 |
| 2021 - 23 | • | 39 | 4.2 | 3.0 | 5.7 | 5.0 | 4.1 |
| 2022 - 24 | • | 37 | 4.0 | 2.8 | 5.5 | 5.1 | 4.2 |
Source: OHID, based on Office for National Statistics data
Further information on stillbirths and infant deaths is available under Stillbirths and Infant Mortality under Pregnancy, Infants and Early Years within Children and Young People where further information is presented for neonatal deaths (under 28 days) and postnatal deaths (28 days or older but less than one year).
The mortality rate among those aged 1-17 years in Hull for deaths registered during 2022-24 is comparable to England, but lower than the average across the Yorkshire and Humber region. Information is not presented for local authorities with low numbers due to confidentiality issues.
Compared with benchmark
| Indicator | Period | England | Yorkshire and the Humber region (statistical) | Kingston upon Hull | East Riding of Yorkshire | North East Lincolnshire | North Lincolnshire | York | North Yorkshire UA | Barnsley | Doncaster | Rotherham | Sheffield | Bradford | Calderdale | Kirklees | Leeds | Wakefield |
|---|---|---|---|---|---|---|---|---|---|---|---|---|---|---|---|---|---|---|
Child mortality rate (1 to 17 years) (Persons 1-17 yrs) | 2022 - 24 | 11.6 | 14.3 | 11.5 | 11.5 | 15.0 | 13.9 | - | 8.4 | 13.7 | 13.1 | 15.1 | 11.9 | 22.4 | 15.6 | 18.0 | 15.0 | 12.5 |
There are a small number of deaths among those aged 1-17 years in Hull so the directly standardised rate per 100,000 population varies year-to-year (standardised to the European Standard Population). There were 20 deaths among those aged 1-17 years in Hull registered over the three year period 2022-24 equating to an average of 6.7 deaths per year.
Compared with benchmark
Child mortality rate (1 to 17 years) (Persons 1-17 yrs)
|
Period
|
Kingston upon Hull |
Yorkshire and the Humber region (statistical)
|
England
|
||||
|---|---|---|---|---|---|---|---|
|
Count
|
Value
|
95%
Lower CI |
95%
Upper CI |
||||
| 2001 - 03 | • | 43 | 26.0 | 18.8 | 35.0 | 21.1 | 18.0 |
| 2002 - 04 | • | 33 | 20.2 | 13.9 | 28.4 | 20.6 | 17.4 |
| 2003 - 05 | • | 30 | 18.4 | 12.4 | 26.3 | 20.2 | 16.9 |
| 2004 - 06 | • | 30 | 18.4 | 12.4 | 26.3 | 19.2 | 16.6 |
| 2005 - 07 | • | 38 | 23.2 | 16.4 | 31.9 | 19.1 | 16.4 |
| 2006 - 08 | • | 40 | 24.1 | 17.2 | 32.8 | 18.7 | 15.9 |
| 2007 - 09 | • | 35 | 20.8 | 14.5 | 28.9 | 17.6 | 15.1 |
| 2008 - 10 | • | 34 | 20.8 | 14.4 | 29.1 | 16.7 | 14.2 |
| 2009 - 11 | • | 22 | 14.0 | 8.8 | 21.3 | 14.7 | 13.3 |
| 2010 - 12 | • | 15 | 9.7 | 5.4 | 16.0 | 14.1 | 12.5 |
| 2011 - 13 | • | 12 | 7.9 | 4.1 | 13.9 | 13.3 | 12.0 |
| 2012 - 14 | • | 18 | 11.5 | 6.8 | 18.3 | 13.3 | 12.0 |
| 2013 - 15 | • | 26 | 16.3 | 10.6 | 24.0 | 13.8 | 12.0 |
| 2014 - 16 | • | 29 | 18.0 | 12.0 | 25.9 | 13.2 | 11.7 |
| 2015 - 17 | • | 21 | 13.1 | 8.0 | 20.1 | 12.5 | 11.3 |
| 2016 - 18 | • | 14 | 8.3 | 4.5 | 14.0 | 12.0 | 11.1 |
| 2017 - 19 | • | 12 | 7.1 | 3.7 | 12.5 | 12.2 | 10.9 |
| 2018 - 20 | • | 16 | 9.7 | 5.5 | 15.7 | 12.5 | 10.4 |
| 2019 - 21 | • | 18 | 11.1 | 6.6 | 17.6 | 11.5 | 10.0 |
| 2020 - 22 | • | 18 | 11.0 | 6.5 | 17.3 | 12.1 | 10.4 |
| 2021 - 23 | • | 19 | 11.2 | 6.8 | 17.6 | 13.0 | 11.2 |
| 2022 - 24 | • | 20 | 11.5 | 7.0 | 17.7 | 14.3 | 11.6 |
Source: OHID, based on Office for National Statistics data
Total Number of Deaths
Numbers by Year of Occurrence
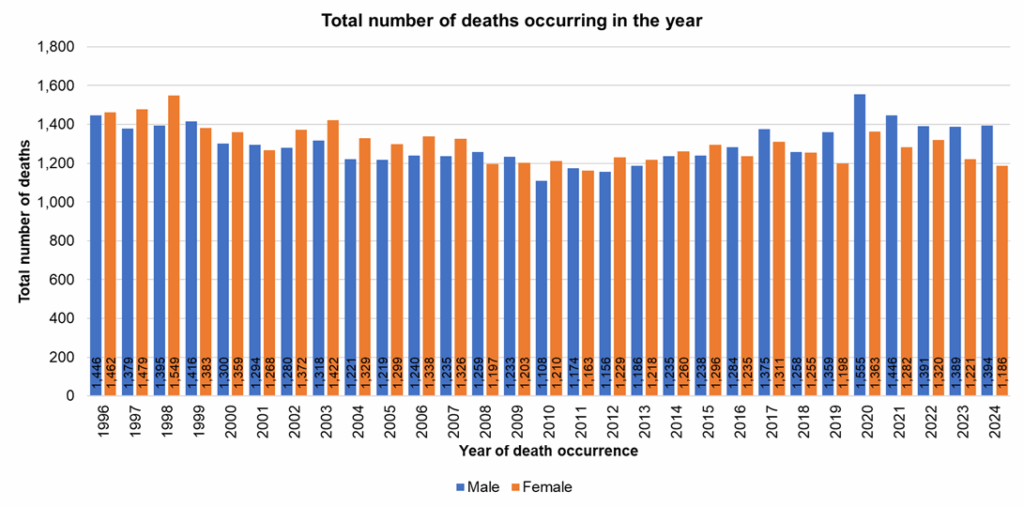
Based on the year in which the death occurred, in the late 1990s, there were around 2,900 deaths each year, but this fell to a low of just over 2,300 deaths for the three year period 2010 to 2012. Since 2012, the number of deaths has increased but has remained around 2,500 deaths each year although it was slightly higher in 2017. However, the marked increase in 2020 and to a lesser extent in 2021 can be seen with the increased mortality rate during the COVID-19 pandemic. The number of deaths in 2022 is still high relatively to the numbers immediately prior to the pandemic. The number of deaths in 2023 and in 2014 are both slightly higher than pre-pandemic levels.
As at October 2025, the number of deaths registered that occurred during 2024 should be almost complete, but there might be some deaths which occurred during 2024 or earlier years that have not yet been registered.

Prior to 2016, for most years, there were more deaths among Hull women than there were among Hull men. The number of men and women in Hull’s population has been around 50% but there has generally been a slightly more older women in Hull which will influence the total number of deaths. However, between 2016 and 2024, the total number of deaths among men has been higher, and this was particularly the case for deaths occurring in 2020 as men had a higher mortality rate from COVID-19.
Numbers by Year of Death Registration
As the majority of analyses use the number of deaths registered in the year rather than the number which occurred in that year, the number of deaths registered in each year is presented below. Most deaths will be registered within the same calendar in which they occur, with only deaths occurring at the end of a calendar year or those involving further investigation being registered later. However, in most cases, the numbers will balance out so that the total number of deaths registered in each calendar year is similar to the total number of occurrences.
A similar pattern occurs for males and females based on year of registration as observed based on year of occurrence.
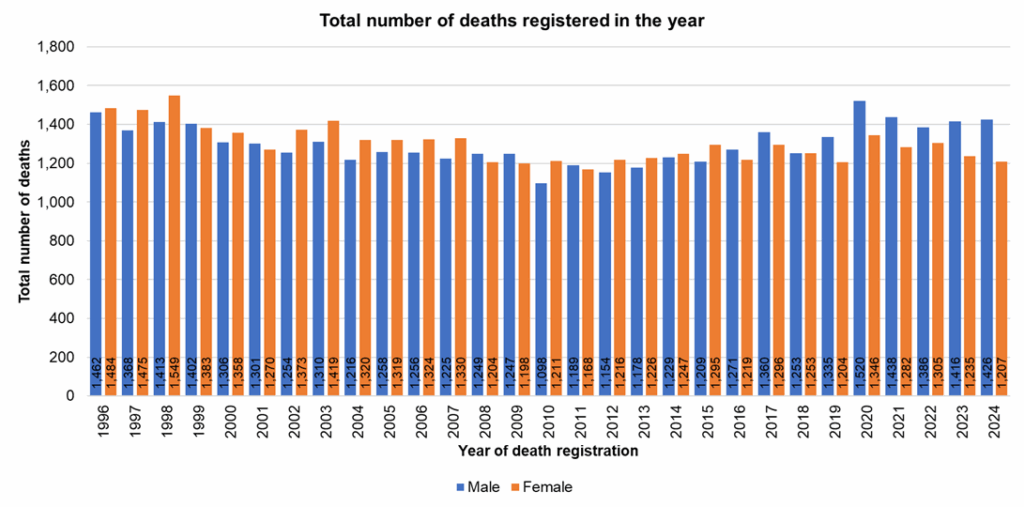
The higher mortality rate from COVID-19 during 2020 and 2021 is evident with a higher number of deaths overall and particularly so for men. Compared the average number of deaths registered between 2017 and 2019, the total number of deaths registered in 2000 was 15.5% higher among men and 7.6% higher among women. The total number of deaths registered among men in all years from 2000 to 2024 has been consistently higher than the average number registered in 2017-19. For women, the total number of deaths registered in 2023 and 2024 has been lower than the average number of deaths registered between 2017 and 2019.
It is possible that the age structure of Hull’s population has changed, and the figures below relate to the total number of deaths registered in the year and do not take into account population, and do not account for the any changes in the age structure of Hull’s population.
| Change in number of deaths registered compared to 2017-19 | Males | Females | Persons |
| 2020 | 15.5 | 7.6 | 11.6 |
| 2021 | 9.3 | 2.5 | 6.0 |
| 2022 | 5.3 | 4.3 | 4.8 |
| 2023 | 7.6 | -1.3 | 3.3 |
| 2024 | 8.4 | -3.5 | 2.6 |
Location of Deaths
The aim of palliative care and end of life services is to enable patients with advancing progressive life limiting illness to be cared for and to die in their preferred place of care with optimal pain and symptom management, supported by skilled staff. It is generally recognised that too many people die in hospital and that this might not be their preferred place of death, and a proportion of these people might prefer to die at home provided that the right care is in place.
Further information can be found under Palliative and End of Life Care under Health Factors under Adults, which includes the percentage of Hull residents who die in hospital, in care homes, at home, in hospices and elsewhere.
Deaths by Cause of Death
Information is presented below which compares different causes of death. More detailed information on specific causes are given within other section of our JSNA.
Detailed Information on Specific Causes of Death
Information on people killed and seriously injured on the roads can be found within Accidents and Injuries Among Children and Young People under Children and Young People under Health Factors. Information on stillbirths, neonatal and infant deaths can be found within Stillbirths and Infant Mortality under Children and Young People and Pregnancy and Infants. Information on the percentage of deaths occurring at different locations can be found within Palliative Care and End of Life under Adults and Health Factors.
The more detailed information relating to specific causes of death includes trends mortality rates and can include information by sex (if information is available) and mortality rates for more specific causes of death such as lung cancer, colorectal cancer, coronary heart disease, stroke, chronic obstructive pulmonary disease (depending on the topic page). Mortality rates might also be presented for all ages and under 75s, or in relation to premature deaths (under 75s) from causes considered to be preventable (depending on the specific cause and if information is available).
This more detailed information can be found on the following topic JSNA pages:
- Cancer
- Cardiovascular Disease
- Coronavirus (COVID-19)
- Dementia
- Diabetes
- Falls and Frailty
- Infectious Diseases
- Mental Ill Health
- Respiratory Disease
- Suicide and Self-Harm
- Alcohol Consumption
- Drug Use
- Smoking and Vaping
Total Number of Deaths by All Main Causes of Death
During the three year period 2022-24, there were 7,976 deaths that were registered among Hull residents of which 2,064 where among men aged under 75 years, 2,165 among men aged 75+ years, 1,238 among women aged under 75 years, and 2,509 among women aged 75+ years. The top five causes of death are summarised after the causes of death table.
The number of deaths by main underlying cause are given below for deaths which were registered during the three year period 2022-24.
Some numbers are not available for the two age groups for males and females as they are either too small and cannot be presented for confidentiality reasons, or they could be derived from subtraction if numbers are presented for some of the remaining groups. So in these cases (marked with an asterisk), the total numbers are presented, and the individual counts for the four group have been combined with either ‘other cancers’ or ‘other causes’ (so the numbers do not sum to the total for these ‘other’ groups).
Furthermore, some of the causes of death overlap with other causes, so the totals for all the causes are greater than the total number of deaths. This is the case for suicide and undetermined injury, deaths due to alcohol, deaths due to drugs, and deaths attributable to smoking.
Alcohol-related and smoking-related deaths use attributable fractions and are the sum of a number of causes of death (for instance, over 80% of deaths from chronic obstructive pulmonary disease are directly attributable to smoking so this measure is the sum of 80% of all these COPD deaths as well as all other causes which are smoking related). See Alcohol Attributable Fractions and Smoking Attributable Fractions within the Glossary.
One of the classifications that had the highest number of deaths was general combination of causes that were smoking-related with 39 deaths per month registered on average between 2022 and 2024.
Overall, 1,997 deaths were caused by cardiovascular disease (25.0%) and the largest category within cardiovascular disease was coronary heart disease (further information is available under Cardiovascular Disease under Health Factors within Adults).
There were 2,113 deaths due to cancer (26.5%) with lung cancer being the cancer site with the largest number of deaths (further information is available under Cancer under Health Factors within Adults).
There were 1,081 deaths from respiratory disease (13.6%) with the largest cause bronchitis, emphysema and other chronic obstructive pulmonary disease (further information is available under Respiratory Disease under Health Factors within Adults).
There were 558 deaths caused by dementia representing 7.0% of all deaths (further information is available under Dementia under Health Factors within Adults).
There were 106 deaths from suicide or undetermined injury (further information is available under Suicide and Self-Harm under Health Factors within Adults).
There were 37 infant deaths under the age one year (further information is available under Stillbirths and Infant Mortality under Pregnancy, Infants and Early Years within Children and Young People).
There were 74 deaths due to COVID-19 were registered during 2022-24. Further information relating to the COVID-19 pandemic can be found under Coronavirus (COVID-19) under Health Factors under Adults, although further more detailed information relating to mortality from COVID-19 is presented below.
| Underlying cause of death (ICD code) for deaths registered 2022-24 | Males <75 | Males 75+ | Females <75 | Females 75+ | Total | Percentage |
| Infant (<1 year) | 22 | 15 | 37 | 0.5 | ||
| Certain infectious and parasitic disease (A00-B99) | 21 | 23 | 11 | 28 | 83 | 1.0 |
| Lip, oral cavity and pharynx cancers (C00-C14) | 22 | 9 | 9 | 4 | 44 | 0.6 |
| Oesophagus cancer (C15) | 30 | 18 | 12 | 15 | 75 | 0.9 |
| Stomach cancer (C16) | 28 | 19 | 5 | 8 | 60 | 0.8 |
| Colorectal cancer (C18-C20) | 61 | 58 | 32 | 47 | 198 | 2.5 |
| Pancreas cancer (C25) | 44 | 25 | 24 | 31 | 124 | 1.6 |
| Larynx cancer (C32)* | 10 | 0.1 | ||||
| Lung cancer (C33-C34) | 141 | 140 | 121 | 144 | 546 | 6.8 |
| Malignant melanoma (C43)* | 25 | 0.3 | ||||
| Mesothelioma cancer (C45)* | 18 | 0.2 | ||||
| Breast cancer (C50) | 0 | 0 | 71 | 55 | 126 | 1.6 |
| Cervical cancer (C53) | 16 | 4 | 20 | 0.3 | ||
| Ovary cancer (C56) | 20 | 26 | 46 | 0.6 | ||
| Prostate cancer (C61) | 33 | 93 | 126 | 1.6 | ||
| Kidney cancer (C64) | 24 | 10 | 7 | 9 | 50 | 0.6 |
| Bladder cancer (C67) | 16 | 35 | 11 | 12 | 74 | 0.9 |
| Brain cancer (C71) | 21 | 11 | 12 | 5 | 49 | 0.6 |
| Leukaemia (C91-C95) | 23 | 15 | 6 | 7 | 51 | 0.6 |
| Other malignant neoplasms of the lymphoid, haematopoietic and related tissue (C81-C90, C96) | 28 | 30 | 16 | 39 | 113 | 1.4 |
| Other cancers (C00-C99, not included above)* | 103 | 88 | 101 | 119 | 358 | 4.5 |
| In situ, benign and unknown status neoplasms (D00-D49) | 9 | 11 | 7 | 12 | 39 | 0.5 |
| Diseases of the blood and immune system (D50-D99)* | 16 | 0.2 | ||||
| Diabetes (E10-E14) | 20 | 31 | 16 | 45 | 112 | 1.4 |
| Dementia (F00-F03) | 16 | 191 | 15 | 336 | 558 | 7.0 |
| Parkinson’s disease (G20) | 11 | 46 | 7 | 34 | 98 | 1.2 |
| Alzheimer’s disease (G30)* | 66 | 124 | 197 | 2.5 | ||
| Epilepsy (G40)* | 16 | 0.2 | ||||
| Other diseases of the nervous system (G00-G99) | 34 | 26 | 30 | 22 | 112 | 1.4 |
| Hypertensive disease (I10-I15) | 15 | 27 | 6 | 59 | 107 | 1.3 |
| Coronary heart disease (I20-I25) | 390 | 298 | 108 | 202 | 998 | 12.5 |
| Heart failure (I50) | 7 | 32 | 7 | 28 | 74 | 0.9 |
| Stroke (I60-I69) | 54 | 124 | 52 | 146 | 376 | 4.7 |
| Aortic aneurysm (I71) | 18 | 19 | 5 | 17 | 59 | 0.7 |
| Other cardiovascular disease (Ioo-I99) | 81 | 89 | 68 | 145 | 383 | 4.8 |
| Influenza and pneumonia (J10-J18) | 65 | 105 | 39 | 118 | 327 | 4.1 |
| Bronchitis, emphysema and chronic obstructive pulmonary disease (J40-J44) | 111 | 150 | 100 | 195 | 556 | 7.0 |
| Asthma (J45)* | 15 | 0.2 | ||||
| Other respiratory disease (J00-J99) | 33 | 72 | 17 | 61 | 183 | 2.3 |
| Digestive system diseases (non-alcohol K00-K99) | 90 | 82 | 67 | 103 | 342 | 4.3 |
| Diseases of the skin, subcutaneous tissue, musculoskeletal and connective system (L00-M99) | 17 | 13 | 19 | 49 | 98 | 1.2 |
| Genitourinary system diseases (N00-N99) | 21 | 54 | 18 | 56 | 149 | 1.9 |
| Deaths caused by transport vehicles (V00-V99) | 20 | 0 | 4 | 0 | 24 | 0.3 |
| Deaths caused by falls (W00-W19) | 28 | 35 | 9 | 47 | 119 | 1.5 |
| Suicide and undetermined injury (X60-X84, Y10-Y34 excluding Y33.9)# | 75 | 4 | 27 | 0 | 106 | 1.3 |
| Other external causes of death (V00-Y99) | 140 | 11 | 39 | 7 | 197 | 2.5 |
| COVID-19 (U07.1-U07.2) | 31 | 69 | 16 | 74 | 190 | 2.4 |
| Other causes of death* | 161 | 36 | 73 | 76 | 292 | 3.7 |
| Smoking-related# | 404 | 428 | 218 | 354 | 1,404 | 17.6 |
| Drug poisoning# | 110 | 37 | 147 | 1.8 | ||
| Alcohol-specific# | 99 | 34 | 133 | 1.7 | ||
| Alcohol-related# | 235 | 50 | 69 | 23 | 376 | 4.7 |
| All cancers (C00-C97) | 574 | 551 | 463 | 525 | 2,113 | 26.5 |
| Dementia (F00-F03) or Alzheimer’s disease (G30) | 755 | 9.5 | ||||
| All cardiovascular disease (I00-I99) | 565 | 589 | 246 | 597 | 1,997 | 25.0 |
| All respiratory (J00-J99) | 213 | 329 | 159 | 380 | 1,081 | 13.6 |
| All external causes (V00-Y99) | 263 | 50 | 79 | 54 | 446 | 5.6 |
| Total over three years | 2,063 | 2,165 | 1,238 | 2,509 | 7,976 | 100.0 |
#Deaths from drug poisoning, alcohol-specific conditions both overlap with the suicide and undermined injury and other conditions and diseases in the case of alcohol-specific deaths. Alcohol-related and smoking-related deaths are also measures which overlap with a number of different causes of death. The number of drug poisoning deaths and the number of alcohol-specific deaths are small for 75+ year age group so have been added to the total number aged under 75 years.
*The numbers are not presented for confidentiality reasons as they represent a small number of deaths and/or the number could be obtained from subtraction. For specific cancers, the total numbers are given, but the number for males and females by age have been added to the ‘other cancer’ category (so numbers do not add up for the ‘other cancers’ category). The total number of deaths from the blood and immune system, Alzheimer’s disease (among under 75s), epilepsy and asthma have been included in the table, but due to small numbers the numbers for males and females for the age groups have been added to ‘other causes of death’ (so numbers do not add up for ‘other causes of death’).
Top Causes of Death
Clearly, the top causes of death depend on which causes are combined. Many different causes can be combined such as combining coronary heart disease, stroke, heart failure and other forms of cardiovascular disease into a single category of ‘all cardiovascular disease’, or combining ‘all cancers’ into a single category. For transparency here, the same causes of death have been used to classify the top causes as those used above in the tables (excluding the ‘other’ categories such as ‘other cancer’ or ‘other circulatory disease’), including drug poisoning, suicide and undetermined injury and alcohol-specific (even though these three causes overlap with some of the other causes).
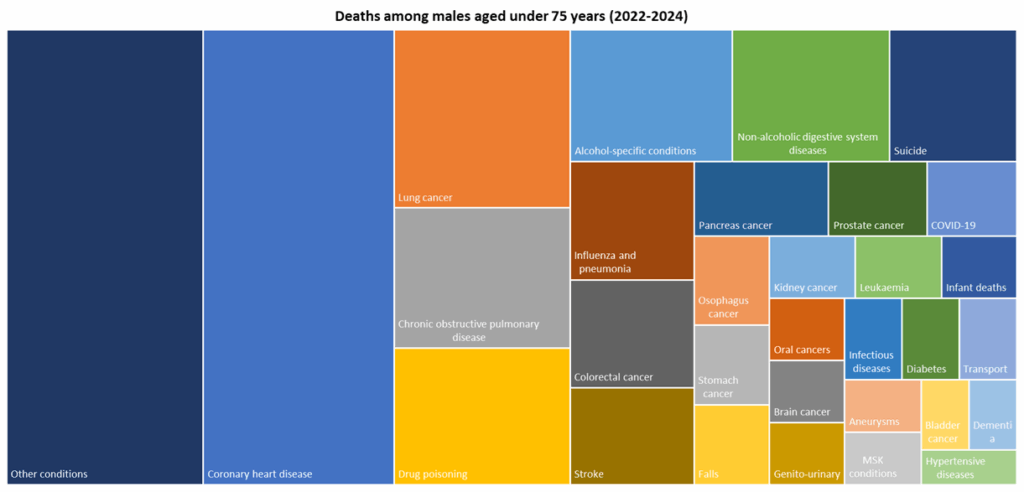
Using these causes of death, the top ten causes of death among males aged under 75 years are as follows (average number of deaths registered each year between 2022-24):
- Coronary heart disease (130)
- Lung cancer (47)
- Chronic obstructive pulmonary disease (37)
- Drug poisoning (36)
- Alcohol-specific deaths (32)
- Non-alcoholic digestive diseases (30)
- Suicide and undetermined injury (25)
- Influenza and pneumonia (22)
- Colorectal cancer (20)
- Stroke (18)
Among men aged under 75 years, cancer accounted for 28% of deaths, cardiovascular disease for 27% of deaths, external cause of death for 13% of deaths, and respiratory disease for 10% of deaths.
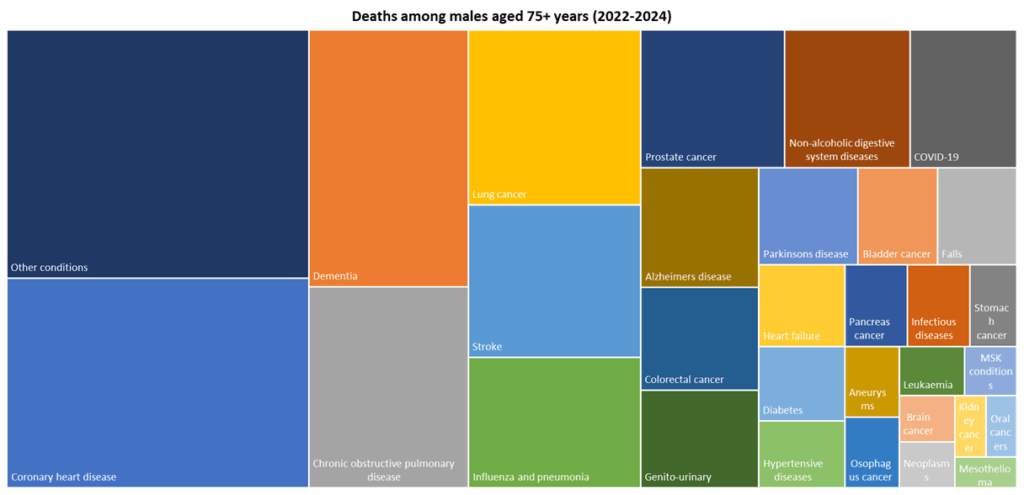
The top ten causes of death among males aged 75+ years are as follows (average number of deaths registered each year between 2022-24):
- Coronary heart disease (99)
- Dementia (64)
- Chronic obstructive pulmonary disease (50)
- Lung cancer (47)
- Stroke (41)
- Influenza and pneumonia (35)
- Prostate cancer (31)
- Non-alcoholic digestive diseases (27)
- COVID-19 (23)
- Alzheimer’s disease (22)
Among men aged 75+ years, cardiovascular disease for 27% of deaths, cancer accounted for 25% of deaths, respiratory disease for 15% of deaths, and dementia or Alzheimer’s disease for 12% of deaths.
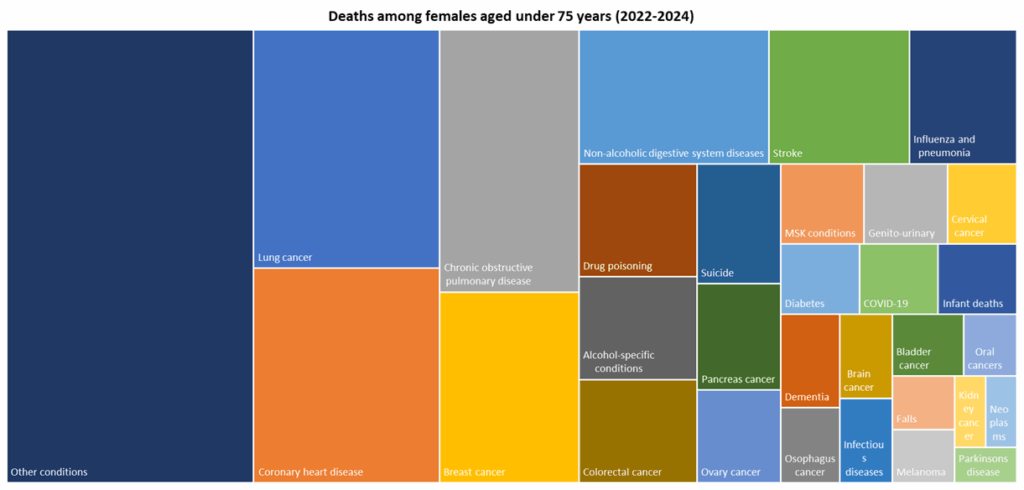
The top ten causes of death among females aged under 75 years are as follows (average number of deaths registered each year between 2022-24):
- Lung cancer (40)
- Coronary heart disease (36)
- Chronic obstructive pulmonary disease (33)
- Breast cancer (24)
- Non-alcoholic digestive diseases (22)
- Stroke (17)
- Influenza and pneumonia (13)
- Drug poisoning (12)
- Alcohol-specific deaths (11)
- Colorectal cancer (11)
Among women aged under 75 years, cancer accounted for 37% of deaths, cardiovascular disease for 20% of deaths, respiratory disease for 13% of deaths, and external causes of death for 6% of deaths.
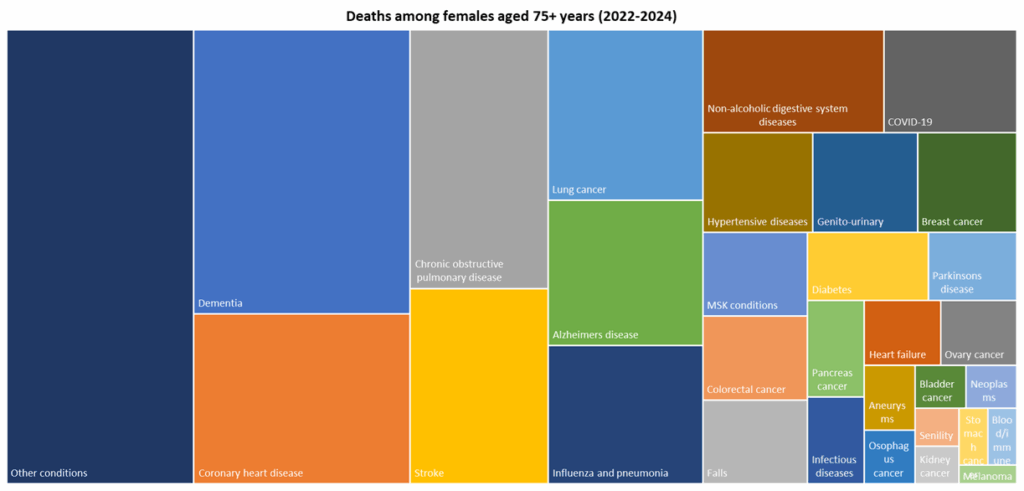
The top ten causes of death among females aged 75+ years are as follows (average number of deaths registered each year between 2022-24):
- Dementia (112)
- Coronary heart disease (67)
- Chronic obstructive pulmonary disease (65)
- Stroke (49)
- Lung cancer (48)
- Alzheimer’s disease (41)
- Influenza and pneumonia (39)
- Non-alcoholic digestive diseases (34)
- COVID-19 (25)
- Hypertensive disease (20)
Among women aged 75+ years, cardiovascular disease for 24% of deaths, cancer accounted for 21% of deaths, dementia or Alzheimer’s disease for 18% of deaths, and respiratory disease for 15% of deaths.
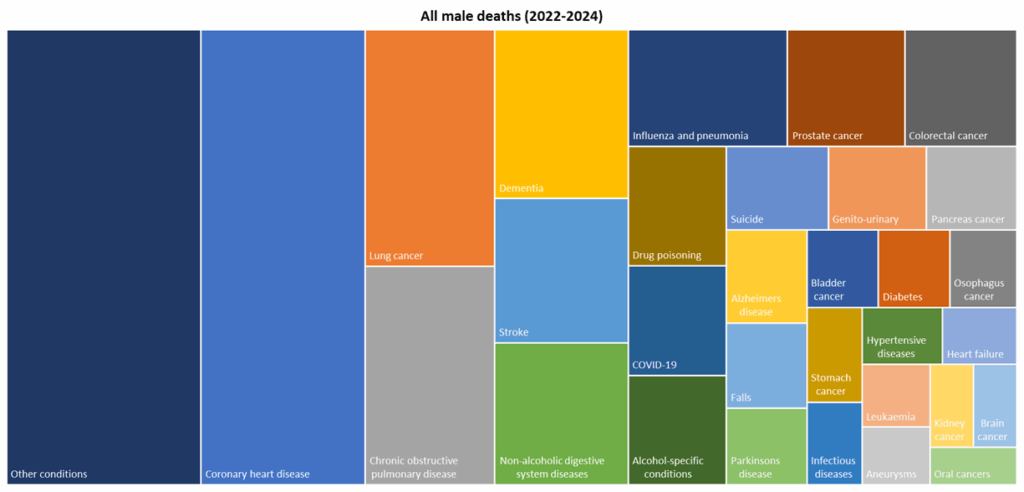
For all males, the top five causes of death registered in 2022-24 were coronary heart disease, lung cancer, chronic obstructive pulmonary disease, dementia and stroke.
Among all male deaths, cardiovascular disease for 27% of deaths, cancer accounted for 27% of all deaths, respiratory disease for 13% of deaths, external causes of death for 9% of all deaths, and dementia or Alzheimer’s disease for 7% of deaths.
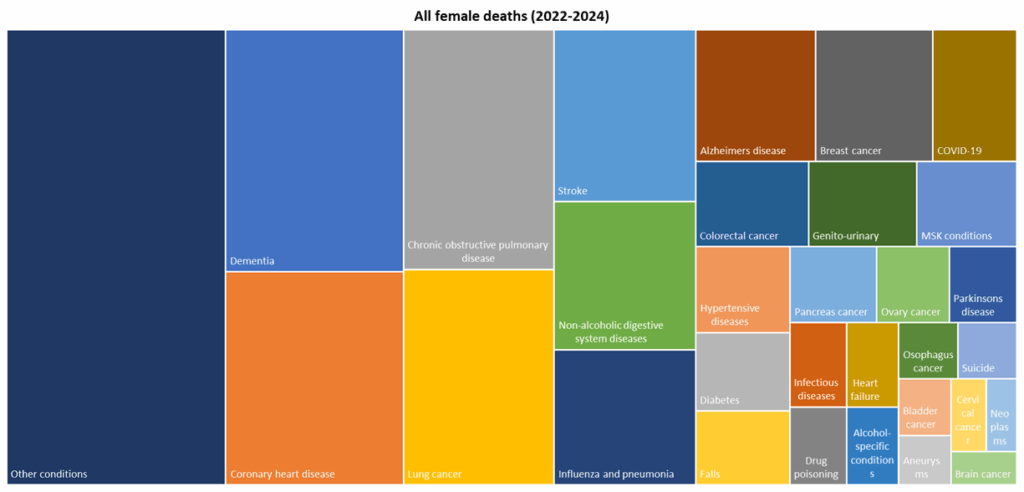
For all females, the top five causes of death were dementia, coronary heart disease, chronic obstructive pulmonary disease, lung cancer and stroke.
Among all female deaths, cancer accounted for 26% of all deaths, cardiovascular disease for 22% of deaths, respiratory disease for 14% of deaths, dementia or Alzheimer’s disease for 13% of deaths, and external causes of death for 4% of all deaths.
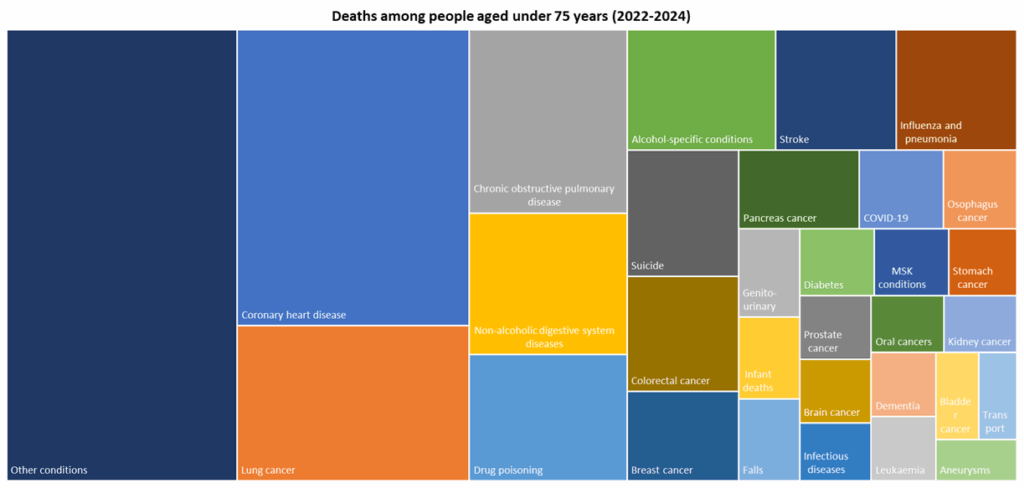
Among men and women aged under 75 years, the top causes of death registered in 2022-24 were coronary heart disease, lung cancer, chronic obstructive pulmonary disease, non-alcoholic digestive diseases and drug poisoning.
Among men and women aged under 75 years, cancer accounted for 31% of deaths, cardiovascular disease for 25% of deaths, respiratory disease for 11% of deaths, and external causes of death for 10% of deaths.
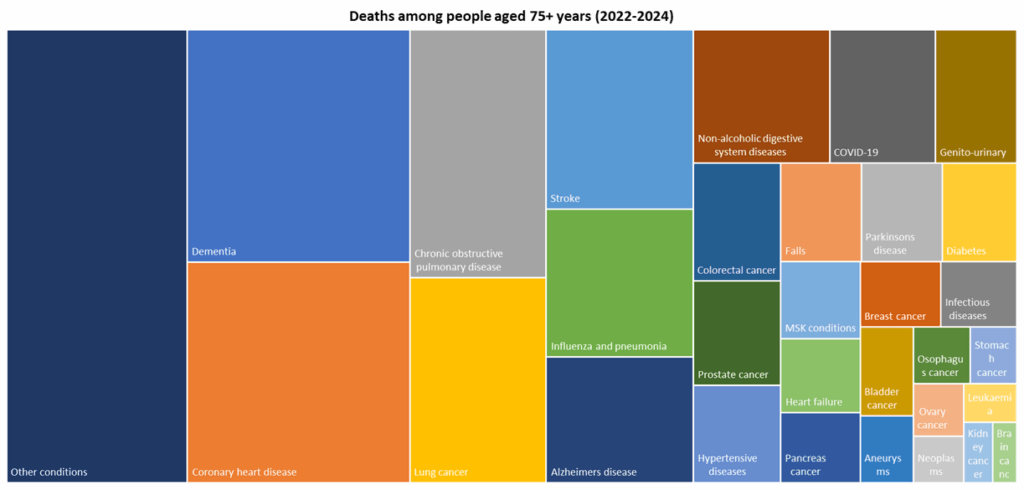
Among men and women aged 75+ years, the top five causes were dementia, coronary heart disease, chronic obstructive pulmonary disease, lung cancer and stroke.
Among men and women aged 75+ years, cardiovascular disease for 25% of deaths, cancer accounted for 23% of deaths, dementia or Alzheimer’s disease for 15% of deaths, and respiratory disease for 15% of deaths.
Overall, across both men and women, the top five causes of death were coronary heart disease, dementia, chronic obstructive pulmonary disease, lung cancer and stroke.
Cancer accounted for 26% of all deaths, cardiovascular disease for 25% of deaths, respiratory disease for 14% of deaths, dementia or Alzheimer’s disease for 9% of deaths, external causes of death for 6% of all deaths.
Trends in Average Number of Deaths Per Year
Whilst there is year-on-year variability in the number of deaths by underlying cause, although it is possible that there have been changes in the way the deaths are coded or more emphasis or awareness of different conditions which could influence the underlying cause over time. Furthermore, some of the causes of death decreased during the pandemic particularly in 2020 when the deaths were highest due to ‘competing causes of death’. For instance, fewer people during the pandemic died from dementia, from influenza and pneumonia and from chronic obstructive pulmonary disease as some of the more vulnerable and frail people died from COVID-19.
In the following table the average deaths for each two year period is given (so the numbers do not add up to the figures above in the ‘total deaths in last three years’ table above).
Deaths from specific causes appear to have decreased over time:
- Stomach cancer
- Larynx cancer (although numbers small so could be just year-on-year variability – see Small Numbers in the Glossary)
- Lung cancer
- Mesothelioma cancer
- Epilepsy
- Stroke (although numbers could be impacted by COVID-19 and competing causes of death)
- Aortic aneurysm
- Asthma
- Senility (numbers were very high a couple of decades ago as it was – and perhaps still is – used as a substitute and catch-all ‘old age’ category, but not used as frequently now as a code for cause of death)
Deaths from specific causes appear to have increased over time:
- Pancreas cancer
- Prostate cancer
- Diabetes
- Dementia, Parkinson’s and Alzheimer’s disease (although dementia figures impacted by pandemic and competing causes of death)
- Hypertensive disease (although numbers in last two years have fallen)
- Non-alcoholic digestive diseases
- Diseases of the skin and subcutaneous tissue and musculoskeletal system and connective tissue (increase in last two years)
- Deaths caused by falls (particularly large increase in the last two years)
- Suicide and undetermined injury (increased in last two years)
- Alcohol-specific
- Alcohol-related
- Drug poisoning
- Dementia or Alzheimer’s disease (although dementia numbers lower in pandemic)
- All cardiovascular disease
- Deaths from all external causes
Impact of the COVID-19 pandemic on the underlying cause of death (more detailed information follows in the next section about this and competing causes of death):
- The frail and vulnerable were more susceptible to dying from COVID-19, and these might have included people with pre-existing disease or who were more susceptible from dying from coronary heart disease, strokes or influenza and pneumonia in a ‘normal’ year. In 2020 and 2021, and to a lesser extent subsequently, many of these frail and vulnerable people died from COVID-19 so this meant that the numbers of people dying from other conditions reduced for 2020 and 2021. This was particularly the case for dementia, chronic obstructive pulmonary disease, and influenza and pneumonia. However, in the case of influenza, there was less influenza circulating over the winter of 2020 due to the lockdowns and less social mixing during the COVID-19 pandemic, and the most vulnerable were more likely to die from COVID-19 rather than influenza or pneumonia. In the case of chronic obstructive pulmonary disease, and influenza and pneumonia, the numbers have increased for 2022-23 but have not ‘returned’ to levels seen prior to the pandemic. Patients with dementia were more likely to die in 2020 and 2021 . It is likely that this was because they were more likely to live in care homes where mortality rates from COVID-19 were higher and that there were increased difficulties with social distancing among people with dementia. The prevalence of dementia in the community has reduced and this is likely to have been because of the higher mortality rate. So with the reduced prevalence, it is perhaps not surprising that there are fewer deaths recorded from dementia in 2022-23. Further information is given below and within Dementia under Health Factors under Adults.
| Underlying cause of death (ICD 10): average deaths registered per year | 2011-12 | 2013-14 | 2015-16 | 2017-18 | 2019-20 | 2021-22 | 2023-24 |
| Infant (<1 year) | 14 | 15 | 13 | 18 | 14 | 13 | 15 |
| Certain infectious and parasitic diseases (A00-B99) | 38 | 27 | 26 | 21 | 18 | 26 | 28 |
| Lip, oral cavity and pharynx cancers (C00-C14) | 10 | 14 | 15 | 14 | 10 | 10 | 16 |
| Oesophageal cancer (C15) | 26 | 28 | 26 | 32 | 31 | 32 | 26 |
| Stomach cancer (C16) | 30 | 27 | 24 | 22 | 19 | 22 | 20 |
| Colorectal cancer (C18-C20) | 70 | 63 | 63 | 64 | 68 | 57 | 73 |
| Pancreas cancer (C25) | 37 | 30 | 38 | 30 | 34 | 41 | 42 |
| Larynx cancer (C32) | 6 | 4 | 6 | 6 | 4 | 4 | 3 |
| Lung cancer (C33-C34) | 198 | 199 | 206 | 200 | 189 | 191 | 183 |
| Malignant melanoma (C43) | 5 | 9 | 7 | 5 | 6 | 7 | 8 |
| Mesothelioma cancer (C45) | 11 | 9 | 6 | 5 | 9 | 7 | 6 |
| Breast cancer (C50) | 43 | 43 | 49 | 44 | 52 | 44 | 42 |
| Cervical cancer (C53) | 8 | 5 | 5 | 3 | 3 | 5 | 8 |
| Ovary cancer (C56) | 15 | 16 | 14 | 16 | 9 | 14 | 15 |
| Prostate cancer (C61) | 36 | 35 | 41 | 47 | 47 | 44 | 43 |
| Kidney cancer (C64) | 16 | 15 | 13 | 17 | 16 | 15 | 18 |
| Bladder cancer (C67) | 22 | 22 | 26 | 24 | 20 | 25 | 21 |
| Brain cancer (C71) | 15 | 19 | 15 | 14 | 14 | 15 | 17 |
| Leukaemia (C91-C95) | 20 | 17 | 18 | 21 | 14 | 19 | 17 |
| Other malignant neoplasms of the lymphoid, haematopoietic and related tissue (C81-C96) | 31 | 27 | 30 | 27 | 33 | 36 | 38 |
| Other cancers (C00-C99) | 110 | 108 | 89 | 108 | 127 | 121 | 119 |
| In situ, benign and unknown status neoplasms (D00-D49) | 17 | 14 | 12 | 14 | 14 | 14 | 14 |
| Diseases of the blood and immune system (D50-D99) | 4 | 6 | 5 | 6 | 8 | 7 | 5 |
| Diabetes (E10-E14) | 18 | 27 | 24 | 30 | 42 | 36 | 36 |
| Dementia (F00-F03) | 143 | 173 | 252 | 253 | 244 | 190 | 182 |
| Parkinson’s disease (G20) | 14 | 20 | 22 | 32 | 30 | 30 | 32 |
| Alzheimer’s disease (G30) | 21 | 24 | 24 | 29 | 44 | 51 | 68 |
| Epilepsy (G40) | 13 | 7 | 5 | 5 | 9 | 5 | 6 |
| Other diseases of the nervous system (G00-G99) | 29 | 28 | 33 | 36 | 31 | 30 | 43 |
| Hypertensive disease (I10-I15) | 27 | 23 | 24 | 31 | 47 | 41 | 33 |
| Coronary heart disease (I20-I25) | 306 | 325 | 295 | 303 | 302 | 314 | 329 |
| Heart failure (I50) | 24 | 24 | 17 | 21 | 16 | 21 | 26 |
| Stroke (I60-I69) | 154 | 173 | 178 | 169 | 147 | 136 | 125 |
| Aortic aneurysm (I71) | 28 | 27 | 23 | 28 | 23 | 19 | 21 |
| Other cardiovascular disease (C00-C99) | 100 | 114 | 99 | 97 | 114 | 124 | 127 |
| Influenza and pneumonia (J10-J18) | 116 | 109 | 125 | 122 | 101 | 75 | 117 |
| Bronchitis, emphysema and chronic obstructive pulmonary disease (J40-J44) | 175 | 190 | 196 | 233 | 186 | 156 | 189 |
| Asthma (J45) | 9 | 10 | 6 | 5 | 6 | 7 | 6 |
| Other respiratory disease (J00-J99) | 91 | 99 | 74 | 81 | 73 | 60 | 65 |
| Digestive system diseases (non-alcoholic K00-K99) | 105 | 102 | 113 | 103 | 91 | 112 | 115 |
| Diseases of the skin, subcutaneous tissue, musculoskeletal and connective system (L00-M99) | 27 | 24 | 22 | 24 | 23 | 27 | 34 |
| Genitourinary system diseases (N00-N99) | 47 | 50 | 48 | 41 | 36 | 49 | 45 |
| Certain conditions originating in the perinatal period or congenital malformations and deformations and chromosomal abnormalities (P00-Q99) | 5 | 6 | 9 | 15 | 17 | 14 | 16 |
| Senility (R54) | 11 | 13 | 11 | 15 | 13 | 9 | 5 |
| Deaths caused by transport vehicles (V00-V99) | 5 | 7 | 7 | 5 | 9 | 11 | 6 |
| Deaths caused by falls (W00-W19) | 15 | 11 | 16 | 20 | 14 | 27 | 43 |
| Suicide and undetermined injury (X60-X84, Y10-Y34 excluding Y33.9)* | 29 | 27 | 32 | 29 | 29 | 30 | 37 |
| Other external causes of death (V00-Y00) | 39 | 40 | 50 | 64 | 63 | 90 | 56 |
| COVID-19 (U07.1-U07.2) | 0 | 0 | 0 | 0 | 194 | 220 | 37 |
| Other causes of death | 58 | 63 | 75 | 73 | 82 | 85 | 101 |
| Drug poisoning* | 21 | 20 | 30 | 37 | 41 | 65 | 42 |
| Alcohol-specific* | 29 | 32 | 34 | 34 | 39 | 47 | 42 |
| Alcohol-related* | 93 | 98 | 98 | 105 | 111 | 126 | 123 |
| Smoking-related* | 467 | 483 | 493 | 526 | 467 | 444 | 472 |
| All cancers (C00-C99)* | 705 | 688 | 688 | 695 | 701 | 706 | 710 |
| Dementia (F00-F03) or Alzheimer’s disease (G30)* | 164 | 197 | 276 | 281 | 288 | 241 | 250 |
| All cardiovascular disease (I00-I99)* | 637 | 685 | 634 | 647 | 648 | 654 | 659 |
| All respiratory disease (J00-J99)* | 390 | 407 | 401 | 440 | 364 | 298 | 376 |
| All external causes (V00-Y99)* | 87 | 85 | 104 | 117 | 113 | 157 | 141 |
| Average annual totals | 2,364 | 2,440 | 2,497 | 2,581 | 2,703 | 2,706 | 2,642 |
*Deaths from drug poisoning, alcohol-specific conditions both overlap with the suicide and undermined injury. Deaths from alcohol-related and smoking-related conditions also overlap with several other causes of death. Therefore, the totals are given in the table so the sum for all the causes in the table sums to more than the total number of deaths in the final table row due to this duplication in numbers. All cancers, dementia and Alzheimer’s disease, all cardiovascular disease, all respiratory disease and all external causes all overlap with the sub-categories of causes too,
Impact of COVID-19 Pandemic on Causes of Death Trends
An analysis of the local mortality data was undertaken in 2022 to examine the deaths from COVID-19 that occurred in 2020 and 2021. The analysis below also examines the secondary causes of death and goes some way into examining the potential competing causes of death among people who are frail and vulnerable. For example, it does appear that the mortality rate for people who had dementia increased during 2020 and 2021. This analysis has not been repeated for deaths that occurred in 2022 although there were still COVID-19 deaths occurring after 2021. The deaths below examine the numbers which occurred in the respective years, but in terms of death registrations, there were 388 deaths from COVID-19 that were registered during 2020, 323 in 2021, 116 in 2022 and 44 in 2023.
In 2020, there were a total of 2,910 deaths and 406 (14.0%) of these had COVID-19 as the underlying cause of death. There was also an additional 49 deaths where COVID-19 was mentioned on the death certificate but it was not the underlying cause of the death.
Among men aged 75+ years who died during 2020, almost one in five deaths were due to COVID-19 with around one in seven deaths due to COVID-19 among women aged 75+ years. Among those aged under 75 years, men were also more likely to have died from COVID-19 during 2020 compared to women.
| Deaths occurring in 2020 only | Males <75 | Males 75+ | Females <75 | Females 75+ | Total |
| COVID-19 death | 73 | 160 | 33 | 140 | 406 |
| Total deaths | 723 | 825 | 412 | 950 | 2,910 |
| Percentage of COVID-19 deaths | 10.1 | 19.4 | 8.0 | 14.7 | 14.0 |
| COVID-19 mentioned but not main cause | 8 | 14 | 2 | 25 | 49 |
There were fewer deaths from COVID-19 in 2021 compared to 2020 overall, but a higher percentage of deaths among those aged under 75 years were due to COVID-19 than for 2020. During 2020, there were a relatively high percentage of deaths in care homes which might account for the differences in the age distributions between 2020 and 2021. There were also more deaths with COVID-19 mentioned on the death certificate but where it was not the underlying cause in 2021 compared to 2020, but this could be due to better testing and detection of COVID-19 and changes to the information recorded on the death certificate over time.
| Deaths occurring in 2021 only | Males <75 | Males 75+ | Females <75 | Females 75+ | Total |
| COVID-19 death | 87 | 93 | 36 | 91 | 307 |
| Total deaths | 687 | 713 | 415 | 851 | 2,666 |
| Percentage of COVID-19 deaths | 12.7 | 13.0 | 8.7 | 10.7 | 11.5 |
| COVID-19 mentioned but not main cause | 15 | 23 | 11 | 20 | 69 |
Among the people who died from COVID-19 as the underlying cause of death during 2020 or 2021, there were some specific medical conditions which were recorded as secondary causes as the person had that medical condition or disease and some of these could have increased the risk of catching COVID-19 or reduced survival from COVID-19. Other secondary causes may have been secondary consequences of the COVID-19 virus, such as pneumonia and acute lower respiratory infection.
The following table gives the number of deaths from COVID and deaths from all other causes where specific medical conditions were mentioned on the death certificate as secondary or contributory causes of death, as well as the number of deaths where that medical condition or disease was the underlying cause of the death in 2020-21. The numbers for 2018-19 are also given for comparison purposes.
The table illustrates the number and pattern of deaths for those medical conditions most likely to appear as secondary causes of death where COVID-19 is given as the underlying cause of death so the table does not necessarily include all the main causes of death.
Note that a death could be in more than one row, for instance, if the underlying cause was COVID-19 but diabetes and obesity were both listed as secondary causes of death, then the death would be included within the 140 COVID-19 deaths with diabetes was a secondary cause and included within the 16 COVID-19 deaths where obesity was a secondary cause.
For instance, there were 429 deaths over the two year period 2020-21 where dementia was the underlying cause of death. Out of the 713 deaths from COVID-19 during 2020-21, 149 had dementia was mentioned as a secondary cause of death and an additional 228 deaths where the cause was not COVID-19 had dementia listed as the secondary cause of death.
| 2020-21 | 2020-21 | 2020-21 | 2018-19 | 2018-19 | |
| COVID deaths | Non-COVID deaths | All deaths | All deaths | All deaths | |
| Secondary cause | Secondary cause | Underlying cause | Secondary cause | Underlying cause | |
| Cause of death (ICD 10 code) | Number | Number | Number | Number | Number |
| Cancer (C00-C99) | 92 | 194 | 1,411 | 199 | 1,341 |
| Diabetes (E10-E14) | 140 | 595 | 67 | 531 | 78 |
| Obesity (E66) | 16 | 51 | 6 | 36 | 5 |
| Dementia (F00-F03) | 149 | 228 | 429 | 267 | 495 |
| Parkinson’s disease (G20) | 14 | 41 | 56 | 56 | 65 |
| Alzheimer’s disease (G30) | 24 | 37 | 95 | 25 | 67 |
| Hypertension (I10) | 134 | 740 | 22 | 656 | 15 |
| Coronary heart disease (I20-I25) | 115 | 490 | 591 | 532 | 578 |
| Pulmonary embolism (I26) | 29 | 163 | 17 | 157 | 13 |
| Atrial fibrillation (I48) | 95 | 448 | 61 | 408 | 48 |
| Heart failure (I50) | 70 | 564 | 33 | 592 | 39 |
| Stroke (I60-I69) | 55 | 255 | 290 | 280 | 322 |
| Pneumonia (J12-J18) | 422 | 510 | 134 | 674 | 236 |
| Unspecified acute lower respiratory infection (J22) | 39 | 189 | 45 | 206 | 56 |
| Chronic obstructive pulmonary disease (J40-J44) | 115 | 450 | 301 | 418 | 448 |
| Asthma (J45) | 32 | 57 | 17 | 37 | 12 |
| Chronic kidney disease (N18) | 96 | 503 | 11 | 562 | 18 |
| All deaths | 713 | 4,863 | 5,576 | 5,056 | 5,056 |
Compared to 2018-19, during 2020-21, there were more people in Hull who died with an underlying cause of death or as a secondary cause of death recorded for all diseases listed in the table except for Parkinson’s disease, stroke and chronic obstructive pulmonary disease. However, the percentage of deaths from these causes out of the total number of deaths was only higher for 2020-21 compared to 2018-19 for diabetes, obesity, Alzheimer’s disease, hypertension, pulmonary embolism, atrial fibrillation, pneumonia and asthma.
| 2020-21 | 2020-21 | 2018-19 | 2018-19 | |
| All deaths | All deaths | All deaths | All deaths | |
| Underlying or secondary cause | Underlying or secondary cause | Underlying or secondary cause | Underlying or secondary cause | |
| Cause of death (ICD 10 code) | Number | Percentage | Number | Percentage |
| Cancer (C00-C99) | 1,697 | 30.4 | 1,537 | 30.4 |
| Diabetes (E10-E14) | 802 | 14.4 | 607 | 12.0 |
| Obesity (E66) | 73 | 1.3 | 40 | 0.8 |
| Dementia (F00-F03) | 806 | 14.5 | 763 | 15.1 |
| Parkinson’s disease (G20) | 111 | 2.0 | 121 | 2.4 |
| Alzheimer’s disease (G30) | 156 | 2.8 | 91 | 1.8 |
| Hypertension (I10) | 896 | 16.1 | 672 | 13.3 |
| Coronary heart disease (I20-I25) | 1,196 | 21.4 | 1,107 | 21.9 |
| Pulmonary embolism (I26) | 209 | 3.7 | 172 | 3.4 |
| Atrial fibrillation (I48) | 604 | 10.8 | 460 | 9.1 |
| Heart failure (I50) | 667 | 12.0 | 632 | 12.5 |
| Stroke (I60-I69) | 600 | 10.8 | 602 | 11.9 |
| Pneumonia (J12-J18) | 1,066 | 19.1 | 910 | 18.0 |
| Unspecified acute lower respiratory infection (J22) | 273 | 4.9 | 263 | 5.2 |
| Chronic obstructive pulmonary disease (J40-J44) | 866 | 15.5 | 870 | 17.2 |
| Asthma (J45) | 106 | 1.9 | 46 | 0.9 |
| Chronic kidney disease (N18) | 610 | 10.9 | 581 | 11.5 |
| Total number of deaths | 5,576 | 5,056 |
Using the percentage of deaths with secondary cause of death for specific conditions in 2018-19 as a comparison, there were more deaths from COVID-19 with a secondary cause of death for cancer, diabetes, obesity, dementia, Parkinson’s disease, Alzheimer’s disease, hypertension, coronary heart disease, pulmonary embolism, atrial fibrillation, stroke, pneumonia, unspecified acute lower respiratory infection, chronic obstructive pulmonary disease, asthma, and chronic kidney disease.
A high percentage of COVID-19 deaths had dementia (21%), diabetes (20%), hypertension (19%), coronary heart disease (16%), chronic obstructive pulmonary disease (16%), chronic kidney disease (14%) or atrial fibrillation (13%) as a secondary cause of death, and almost six in ten of COVID-19 deaths had pneumonia listed as a secondary cause of death.
The percentage of people dying from some of these conditions as an underlying cause of death was lower in 2020-21 compared to 2018-19, which suggests that the people with these conditions were dying from COVID-19 rather than an existing medical condition, suggesting that the underlying cause of death was substituted with COVID-19 among some of the most vulnerable and frail people who were most at risk of death.
These local analyses suggested around 40 additional people who had dementia died compared to a ‘usual’ or ‘typical’ year, but the number of patients who were recorded as having dementia reduced from 2,293 in 2019/20 to 1,990 in 2020/21 – a reduction of 303 patients (see Dementia under Health Factors within Adults for more information). This suggests that the 40 additional deaths from dementia could be a significant underestimate given the size of the decrease in numbers on the GP disease registers. The populations differ though as the numbers from the GP registers are based on patients registered with Hull GPs and there are over 310,000 patients registered with Hull GPs whereas the local analysis used resident population estimates for Hull and it is estimated that there are around 269,000 residents of Hull.
| 2020-21 | 2020-21 | 2020-21 | 2018-19 | 2018-19 | |
| COVID deaths | Non-COVID deaths | All deaths | All deaths | All deaths | |
| Secondary cause | Secondary cause | Underlying cause | Secondary cause | Underlying cause | |
| Cause of death (ICD 10 code) | Percentage | Percentage | Percentage | Percentage | Percentage |
| Cancer (C00-C99) | 12.9 | 4.0 | 25.3 | 3.9 | 26.5 |
| Diabetes (E10-E14) | 19.6 | 12.2 | 1.2 | 10.5 | 1.5 |
| Obesity (E66) | 2.2 | 1.0 | 0.1 | 0.7 | 0.1 |
| Dementia (F00-F03) | 20.9 | 4.7 | 7.7 | 5.3 | 9.8 |
| Parkinson’s disease (G20) | 2.0 | 0.8 | 1.0 | 1.1 | 1.3 |
| Alzheimer’s disease (G30) | 3.4 | 0.8 | 1.7 | 0.5 | 1.3 |
| Hypertension (I10) | 18.8 | 15.2 | 0.4 | 13.0 | 0.3 |
| Coronary heart disease (I20-I25) | 16.1 | 10.1 | 10.6 | 10.5 | 11.4 |
| Pulmonary embolism (I26) | 4.1 | 3.4 | 0.3 | 3.1 | 0.3 |
| Atrial fibrillation (I48) | 13.3 | 9.2 | 1.1 | 11.7 | 0.8 |
| Heart failure (I50) | 9.8 | 11.6 | 0.6 | 11.7 | 0.8 |
| Stroke (I60-I69) | 7.7 | 5.2 | 5.2 | 5.5 | 6.4 |
| Pneumonia (J12-J18) | 59.2 | 10.5 | 2.4 | 13.3 | 4.7 |
| Unspecified acute lower respiratory infection (J22) | 5.5 | 3.9 | 0.8 | 4.1 | 1.1 |
| Chronic obstructive pulmonary disease (J40-J44) | 16.1 | 9.3 | 5.4 | 8.3 | 8.9 |
| Asthma (J45) | 4.5 | 1.2 | 0.3 | 0.7 | 0.2 |
| Chronic kidney disease (N18) | 13.5 | 10.3 | 0.2 | 11.1 | 0.4 |
Mortality Rates
All Ages
The directly standardised number of deaths per 100,000 population (standardised to the European Standard Population) for all ages is the highest in the region for deaths registered during the three year period 2021-23, and is substantially higher than the national average, and fourth highest among lower-tier local authorities in England.
The rates in Hull are 30% higher in Hull compared to England for 2022-24.
Compared with benchmark
| Indicator | Period | England | Yorkshire and the Humber region (statistical) | Kingston upon Hull | East Riding of Yorkshire | North East Lincolnshire | North Lincolnshire | York | North Yorkshire UA | Barnsley | Doncaster | Rotherham | Sheffield | Bradford | Calderdale | Kirklees | Leeds | Wakefield |
|---|---|---|---|---|---|---|---|---|---|---|---|---|---|---|---|---|---|---|
Mortality rate from all causes, all ages (Persons All ages) | 2022 - 24 | 952 | 1031 | 1241 | 939 | 1130 | 1047 | 929 | 884 | 1131 | 1137 | 1089 | 1044 | 1089 | 1027 | 1045 | 1008 | 1098 |
Mortality rate from all causes, all ages (Male All ages) | 2022 - 24 | 1121 | 1206 | 1478 | 1091 | 1322 | 1240 | 1090 | 1036 | 1312 | 1332 | 1209 | 1203 | 1280 | 1217 | 1228 | 1201 | 1273 |
Mortality rate from all causes, all ages (Female All ages) | 2022 - 24 | 816 | 888 | 1045 | 813 | 963 | 882 | 804 | 760 | 987 | 975 | 982 | 914 | 929 | 879 | 895 | 859 | 960 |
The mortality rate in Hull steadily decreased by 14% between 2001-03 and 2010-12 from 1,408 deaths per 100,000 population to a low of 1,205 deaths per 100,000 population in 2010-12. However, since then the rate in Hull has steadily increased until 2020-22 with decreases seen for the two most recent three-year periods 2021-23 and 2022-24. The mortality rate in 2022-24 is 12% lower than the rate in 2001-03.
In contrast, the rate in England decreased by 22% between 2001-03 and 2022-24 with a decrease for almost every year, although there was an increase in England between 2017-19 and 2020-22 due to the pandemic.
The inequalities gap between Hull and England was broadly the same between 2001-03 and 2010-12 whilst mortality rates decreasing in both Hull and England, but with the subsequent increases in Hull, the inequalities gap has widened. The mortality rate in Hull was 15% higher than England in 2001-03 but is currently 30% higher.
There were 7,976 deaths to Hull residents registered during 2022-24 equating to around 2,659 deaths per year. In 2017-19, there has been 7,701 deaths equating to 2,567 deaths per year so the impact of the increasing number of deaths in the later part of the pandemic and subsequently is still evident for 2022-24.
Compared with benchmark
Mortality rate from all causes, all ages (Persons All ages)
|
Period
|
Kingston upon Hull |
Yorkshire and the Humber region (statistical)
|
England
|
||||
|---|---|---|---|---|---|---|---|
|
Count
|
Value
|
95%
Lower CI |
95%
Upper CI |
||||
| 2001 - 03 | • | 7928 | 1408 | 1377 | 1440 | 1269 | 1226 |
| 2002 - 04 | • | 7894 | 1404 | 1373 | 1436 | 1251 | 1202 |
| 2003 - 05 | • | 7843 | 1392 | 1361 | 1423 | 1222 | 1173 |
| 2004 - 06 | • | 7695 | 1359 | 1329 | 1391 | 1183 | 1131 |
| 2005 - 07 | • | 7714 | 1359 | 1329 | 1391 | 1164 | 1107 |
| 2006 - 08 | • | 7590 | 1334 | 1303 | 1364 | 1152 | 1090 |
| 2007 - 09 | • | 7453 | 1305 | 1275 | 1336 | 1132 | 1066 |
| 2008 - 10 | • | 7208 | 1251 | 1222 | 1281 | 1103 | 1041 |
| 2009 - 11 | • | 7113 | 1229 | 1200 | 1258 | 1069 | 1004 |
| 2010 - 12 | • | 7038 | 1205 | 1177 | 1234 | 1058 | 989 |
| 2011 - 13 | • | 7132 | 1212 | 1184 | 1241 | 1053 | 979 |
| 2012 - 14 | • | 7250 | 1222 | 1193 | 1250 | 1041 | 971 |
| 2013 - 15 | • | 7385 | 1242 | 1213 | 1271 | 1041 | 974 |
| 2014 - 16 | • | 7468 | 1250 | 1221 | 1279 | 1034 | 970 |
| 2015 - 17 | • | 7648 | 1276 | 1247 | 1305 | 1041 | 975 |
| 2016 - 18 | • | 7649 | 1265 | 1236 | 1294 | 1036 | 967 |
| 2017 - 19 | • | 7701 | 1262 | 1233 | 1290 | 1027 | 955 |
| 2018 - 20 | • | 7911 | 1284 | 1256 | 1313 | 1065 | 986 |
| 2019 - 21 | • | 8125 | 1302 | 1274 | 1331 | 1070 | 999 |
| 2020 - 22 | • | 8278 | 1313 | 1285 | 1342 | 1085 | 1012 |
| 2021 - 23 | • | 8063 | 1265 | 1237 | 1293 | 1047 | 981 |
| 2022 - 24 | • | 7976 | 1241 | 1213 | 1268 | 1031 | 952 |
Source: OHID, based on Office for National Statistics data
A similar patter occurred for men although the initial rate of decrease was greater.
For men, the mortality rate in 2022-24 is 15% lower than the rate for 2001-03 for Hull whereas for England it is 25% lower, with the rate in 2022-24 32% higher in Hull compared to England.
There were 4,229 deaths among Hull men registered during 2022-24 an average of 1,410 each year.
Compared with benchmark
Mortality rate from all causes, all ages (Male All ages)
|
Period
|
Kingston upon Hull |
Yorkshire and the Humber region (statistical)
|
England
|
||||
|---|---|---|---|---|---|---|---|
|
Count
|
Value
|
95%
Lower CI |
95%
Upper CI |
||||
| 2001 - 03 | • | 3866 | 1747 | 1686 | 1809 | 1556 | 1489 |
| 2002 - 04 | • | 3781 | 1688 | 1629 | 1748 | 1523 | 1452 |
| 2003 - 05 | • | 3784 | 1663 | 1605 | 1722 | 1476 | 1408 |
| 2004 - 06 | • | 3732 | 1612 | 1557 | 1669 | 1428 | 1357 |
| 2005 - 07 | • | 3741 | 1597 | 1542 | 1654 | 1390 | 1323 |
| 2006 - 08 | • | 3732 | 1578 | 1524 | 1634 | 1371 | 1297 |
| 2007 - 09 | • | 3721 | 1551 | 1498 | 1605 | 1341 | 1265 |
| 2008 - 10 | • | 3595 | 1476 | 1426 | 1528 | 1308 | 1233 |
| 2009 - 11 | • | 3535 | 1445 | 1395 | 1496 | 1267 | 1189 |
| 2010 - 12 | • | 3442 | 1399 | 1350 | 1449 | 1249 | 1166 |
| 2011 - 13 | • | 3521 | 1422 | 1373 | 1472 | 1242 | 1153 |
| 2012 - 14 | • | 3561 | 1417 | 1369 | 1467 | 1222 | 1141 |
| 2013 - 15 | • | 3616 | 1430 | 1382 | 1480 | 1219 | 1143 |
| 2014 - 16 | • | 3706 | 1443 | 1394 | 1492 | 1211 | 1135 |
| 2015 - 17 | • | 3837 | 1476 | 1428 | 1526 | 1219 | 1138 |
| 2016 - 18 | • | 3881 | 1473 | 1425 | 1523 | 1209 | 1128 |
| 2017 - 19 | • | 3948 | 1480 | 1432 | 1530 | 1196 | 1114 |
| 2018 - 20 | • | 4108 | 1530 | 1481 | 1580 | 1248 | 1158 |
| 2019 - 21 | • | 4293 | 1563 | 1515 | 1613 | 1256 | 1179 |
| 2020 - 22 | • | 4345 | 1562 | 1514 | 1612 | 1275 | 1196 |
| 2021 - 23 | • | 4241 | 1497 | 1450 | 1545 | 1225 | 1155 |
| 2022 - 24 | • | 4229 | 1478 | 1431 | 1525 | 1206 | 1121 |
Source: OHID, based on Office for National Statistics data
Whilst the mortality rate for women followed a similar pattern, both the initial decrease and subsequent increase has not been as large as that for men.
For women, the mortality rate in 2022-24 is 11% lower than the rate for 2001-03 for Hull whereas for England it is 22% lower, with the rate in Hull in 2022-24 28% lower than for England.
There were 3,747 deaths among Hull women that were registered during 2022-24, an average of 1,249 each year.
Compared with benchmark
Mortality rate from all causes, all ages (Female All ages)
|
Period
|
Kingston upon Hull |
Yorkshire and the Humber region (statistical)
|
England
|
||||
|---|---|---|---|---|---|---|---|
|
Count
|
Value
|
95%
Lower CI |
95%
Upper CI |
||||
| 2001 - 03 | • | 4062 | 1174 | 1138 | 1211 | 1075 | 1043 |
| 2002 - 04 | • | 4113 | 1198 | 1161 | 1235 | 1063 | 1026 |
| 2003 - 05 | • | 4059 | 1189 | 1153 | 1227 | 1044 | 1004 |
| 2004 - 06 | • | 3963 | 1169 | 1132 | 1206 | 1010 | 968 |
| 2005 - 07 | • | 3973 | 1176 | 1140 | 1214 | 1003 | 950 |
| 2006 - 08 | • | 3858 | 1145 | 1108 | 1182 | 993 | 938 |
| 2007 - 09 | • | 3732 | 1110 | 1074 | 1146 | 979 | 918 |
| 2008 - 10 | • | 3613 | 1068 | 1033 | 1104 | 951 | 897 |
| 2009 - 11 | • | 3578 | 1055 | 1021 | 1091 | 922 | 864 |
| 2010 - 12 | • | 3596 | 1051 | 1016 | 1086 | 915 | 854 |
| 2011 - 13 | • | 3611 | 1048 | 1013 | 1083 | 912 | 846 |
| 2012 - 14 | • | 3689 | 1065 | 1031 | 1100 | 903 | 840 |
| 2013 - 15 | • | 3769 | 1090 | 1055 | 1126 | 904 | 843 |
| 2014 - 16 | • | 3762 | 1091 | 1056 | 1127 | 896 | 840 |
| 2015 - 17 | • | 3811 | 1109 | 1074 | 1145 | 903 | 846 |
| 2016 - 18 | • | 3768 | 1092 | 1057 | 1128 | 901 | 838 |
| 2017 - 19 | • | 3753 | 1083 | 1048 | 1118 | 892 | 826 |
| 2018 - 20 | • | 3803 | 1087 | 1052 | 1122 | 920 | 848 |
| 2019 - 21 | • | 3832 | 1089 | 1054 | 1124 | 920 | 854 |
| 2020 - 22 | • | 3933 | 1108 | 1074 | 1144 | 932 | 864 |
| 2021 - 23 | • | 3822 | 1071 | 1037 | 1105 | 902 | 839 |
| 2022 - 24 | • | 3747 | 1045 | 1011 | 1079 | 888 | 816 |
Source: OHID, based on Office for National Statistics data
Premature Deaths (Under 75 Years)
The under 75 year standardised mortality ratio was 145 for Hull for 2019-23 so the premature mortality rate after adjusting for age was 45% higher in Hull compared to England.
Compared with benchmark
| Indicator | Period | England | Yorkshire and the Humber region (statistical) | Kingston upon Hull | East Riding of Yorkshire | North East Lincolnshire | North Lincolnshire | York | North Yorkshire UA | Barnsley | Doncaster | Rotherham | Sheffield | Bradford | Calderdale | Kirklees | Leeds | Wakefield |
|---|---|---|---|---|---|---|---|---|---|---|---|---|---|---|---|---|---|---|
Mortality from all causes (aged under 75) (Persons <75 yrs) | 2019 - 23 | 100.0 | 110.5 | 144.9 | 89.9 | 119.7 | 109.0 | 93.5 | 84.5 | 126.0 | 123.3 | 123.9 | 108.6 | 124.1 | 109.1 | 113.3 | 109.6 | 121.4 |
The directly standardised number of deaths per 100,000 population (standardised to the European Standard Population) for under 75 deaths is the highest in the region, and is substantially higher than the national average. For deaths registered during 2022-24, the premature mortality rate in Hull is third highest out of 294 lower tier local authorities in England (second highest for men and sixth highest for women). Hart in Hampshire has the lowest premature mortality rate with 200 deaths per 100,000 population.
Compared with benchmark
| Indicator | Period | England | Yorkshire and the Humber region (statistical) | Kingston upon Hull | East Riding of Yorkshire | North East Lincolnshire | North Lincolnshire | York | North Yorkshire UA | Barnsley | Doncaster | Rotherham | Sheffield | Bradford | Calderdale | Kirklees | Leeds | Wakefield |
|---|---|---|---|---|---|---|---|---|---|---|---|---|---|---|---|---|---|---|
Under 75 mortality rate from all causes (Persons <75 yrs) | 2022 - 24 | 337.6 | 377.5 | 504.9 | 314.8 | 449.4 | 387.1 | 323.3 | 290.9 | 426.1 | 432.9 | 409.8 | 375.5 | 425.5 | 372.1 | 381.6 | 364.1 | 402.5 |
Under 75 mortality rate from all causes (Male <75 yrs) | 2022 - 24 | 415.1 | 461.0 | 630.8 | 380.2 | 559.8 | 477.8 | 400.1 | 355.0 | 509.4 | 526.0 | 477.6 | 450.9 | 529.2 | 466.1 | 471.1 | 441.6 | 486.7 |
Under 75 mortality rate from all causes (Female <75 yrs) | 2022 - 24 | 264.5 | 297.8 | 378.6 | 252.5 | 343.4 | 299.3 | 251.6 | 230.2 | 345.6 | 342.5 | 345.0 | 303.1 | 325.7 | 283.4 | 295.9 | 291.3 | 321.6 |
As mentioned above, there were 7,976 deaths registered for Hull residents between 2022 and 2024, and over four in ten (41%) of them occurred under the age of 75 years. Among the 4,229 male deaths, 2,064 (49%) were premature and among the 3,747 female deaths, 1,238 (33%) were premature.
The impact of the COVID-19 pandemic is clearly evident for both men and women with higher mortality rates among those aged under 75 years. The rate increased only slightly between 2017-19 and 2018-20 with one year of data from the pandemic included for 2018-20, but increased by a higher percentage between 2017-19 and 2019-21 as two years of data from the pandemic was included. During 2020, there were 388 COVID-19 deaths registered among Hull residents, 323 during 2021, 116 during 2022, 44 during 2023 and 30 COVID-19 deaths registered during 2024.
Compared with benchmark
Under 75 mortality rate from all causes (Persons <75 yrs)
|
Period
|
Kingston upon Hull |
Yorkshire and the Humber region (statistical)
|
England
|
||||
|---|---|---|---|---|---|---|---|
|
Count
|
Value
|
95%
Lower CI |
95%
Upper CI |
||||
| 2001 - 03 | • | 3080 | 562.4 | 542.6 | 582.8 | 475.9 | 452.2 |
| 2002 - 04 | • | 3066 | 559.2 | 539.4 | 579.5 | 462.5 | 439.2 |
| 2003 - 05 | • | 3074 | 557.4 | 537.6 | 577.6 | 448.7 | 425.8 |
| 2004 - 06 | • | 3050 | 551.4 | 531.8 | 571.5 | 436.1 | 411.6 |
| 2005 - 07 | • | 3002 | 541.7 | 522.2 | 561.6 | 427.3 | 400.6 |
| 2006 - 08 | • | 2986 | 541.2 | 521.8 | 561.2 | 420.4 | 391.3 |
| 2007 - 09 | • | 2943 | 533.1 | 513.7 | 552.9 | 410.2 | 380.3 |
| 2008 - 10 | • | 2875 | 518.4 | 499.4 | 538.0 | 400.1 | 370.5 |
| 2009 - 11 | • | 2792 | 501.6 | 482.9 | 520.8 | 389.7 | 358.9 |
| 2010 - 12 | • | 2660 | 475.5 | 457.4 | 494.2 | 381.2 | 350.0 |
| 2011 - 13 | • | 2625 | 464.2 | 446.4 | 482.6 | 373.3 | 342.5 |
| 2012 - 14 | • | 2647 | 463.1 | 445.3 | 481.3 | 365.8 | 337.2 |
| 2013 - 15 | • | 2731 | 472.3 | 454.4 | 490.6 | 363.0 | 335.2 |
| 2014 - 16 | • | 2804 | 476.6 | 458.8 | 494.9 | 362.5 | 334.3 |
| 2015 - 17 | • | 2888 | 477.8 | 460.3 | 495.8 | 362.8 | 332.6 |
| 2016 - 18 | • | 2861 | 462.3 | 445.4 | 479.7 | 363.9 | 331.3 |
| 2017 - 19 | • | 2932 | 465.6 | 448.8 | 482.9 | 362.0 | 327.0 |
| 2018 - 20 | • | 3010 | 471.3 | 454.6 | 488.6 | 373.7 | 337.7 |
| 2019 - 21 | • | 3252 | 501.6 | 484.4 | 519.2 | 383.3 | 348.6 |
| 2020 - 22 | • | 3359 | 515.6 | 498.2 | 533.4 | 392.1 | 355.3 |
| 2021 - 23 | • | 3314 | 507.2 | 490.0 | 524.8 | 385.9 | 348.9 |
| 2022 - 24 | • | 3302 | 504.9 | 487.8 | 522.5 | 377.5 | 337.6 |
Source: OHID, based on Office for National Statistics data
Under 75 mortality rate from all causes (Male <75 yrs)
|
Period
|
Kingston upon Hull |
Yorkshire and the Humber region (statistical)
|
England
|
||||
|---|---|---|---|---|---|---|---|
|
Count
|
Value
|
95%
Lower CI |
95%
Upper CI |
||||
| 2001 - 03 | • | 1926 | 723.1 | 690.8 | 756.5 | 595.4 | 564.8 |
| 2002 - 04 | • | 1860 | 697.2 | 665.4 | 730.0 | 579.8 | 547.4 |
| 2003 - 05 | • | 1861 | 689.0 | 657.6 | 721.5 | 559.2 | 528.9 |
| 2004 - 06 | • | 1818 | 666.9 | 636.1 | 698.8 | 542.0 | 510.2 |
| 2005 - 07 | • | 1801 | 656.1 | 625.7 | 687.7 | 525.1 | 494.8 |
| 2006 - 08 | • | 1797 | 656.8 | 626.3 | 688.4 | 515.4 | 481.8 |
| 2007 - 09 | • | 1802 | 657.4 | 626.8 | 689.0 | 502.0 | 467.5 |
| 2008 - 10 | • | 1761 | 641.3 | 611.2 | 672.6 | 489.8 | 455.1 |
| 2009 - 11 | • | 1702 | 620.2 | 590.5 | 651.0 | 475.7 | 440.3 |
| 2010 - 12 | • | 1582 | 572.9 | 544.5 | 602.4 | 464.9 | 427.4 |
| 2011 - 13 | • | 1592 | 568.8 | 540.7 | 598.0 | 454.1 | 417.6 |
| 2012 - 14 | • | 1600 | 564.9 | 537.0 | 593.8 | 445.2 | 410.5 |
| 2013 - 15 | • | 1641 | 574.1 | 546.1 | 603.2 | 441.0 | 408.3 |
| 2014 - 16 | • | 1671 | 571.8 | 544.1 | 600.5 | 440.0 | 405.9 |
| 2015 - 17 | • | 1744 | 577.0 | 549.8 | 605.2 | 439.7 | 404.2 |
| 2016 - 18 | • | 1758 | 566.5 | 540.1 | 594.0 | 439.5 | 402.9 |
| 2017 - 19 | • | 1811 | 573.7 | 547.4 | 601.0 | 439.4 | 398.6 |
| 2018 - 20 | • | 1867 | 584.3 | 557.9 | 611.5 | 455.6 | 413.8 |
| 2019 - 21 | • | 2038 | 628.3 | 601.2 | 656.3 | 469.1 | 428.8 |
| 2020 - 22 | • | 2099 | 643.9 | 616.6 | 672.2 | 478.4 | 437.9 |
| 2021 - 23 | • | 2069 | 632.8 | 605.7 | 660.8 | 469.4 | 429.3 |
| 2022 - 24 | • | 2064 | 630.8 | 603.8 | 658.8 | 461.0 | 415.1 |
Source: OHID, based on Office for National Statistics data
Under 75 mortality rate from all causes (Female <75 yrs)
|
Period
|
Kingston upon Hull |
Yorkshire and the Humber region (statistical)
|
England
|
||||
|---|---|---|---|---|---|---|---|
|
Count
|
Value
|
95%
Lower CI |
95%
Upper CI |
||||
| 2001 - 03 | • | 1154 | 409.6 | 386.2 | 434.1 | 367.1 | 348.5 |
| 2002 - 04 | • | 1206 | 427.6 | 403.6 | 452.5 | 355.2 | 339.2 |
| 2003 - 05 | • | 1213 | 430.6 | 406.5 | 455.7 | 347.0 | 330.2 |
| 2004 - 06 | • | 1232 | 439.7 | 415.3 | 465.2 | 338.1 | 319.8 |
| 2005 - 07 | • | 1201 | 430.5 | 406.3 | 455.7 | 336.2 | 312.3 |
| 2006 - 08 | • | 1189 | 428.3 | 404.2 | 453.6 | 331.3 | 306.3 |
| 2007 - 09 | • | 1141 | 411.5 | 387.8 | 436.3 | 324.0 | 298.1 |
| 2008 - 10 | • | 1114 | 398.7 | 375.4 | 423.0 | 315.8 | 290.6 |
| 2009 - 11 | • | 1090 | 387.0 | 364.2 | 411.0 | 308.8 | 281.9 |
| 2010 - 12 | • | 1078 | 381.4 | 358.7 | 405.1 | 302.2 | 276.7 |
| 2011 - 13 | • | 1033 | 362.6 | 340.6 | 385.7 | 296.8 | 271.5 |
| 2012 - 14 | • | 1047 | 364.0 | 342.1 | 387.0 | 290.2 | 267.8 |
| 2013 - 15 | • | 1090 | 373.7 | 351.6 | 396.8 | 288.5 | 265.9 |
| 2014 - 16 | • | 1133 | 383.6 | 361.3 | 406.8 | 288.4 | 266.3 |
| 2015 - 17 | • | 1144 | 379.6 | 357.7 | 402.5 | 289.0 | 264.7 |
| 2016 - 18 | • | 1103 | 357.8 | 336.9 | 379.7 | 291.3 | 263.4 |
| 2017 - 19 | • | 1121 | 356.9 | 336.2 | 378.6 | 287.7 | 259.0 |
| 2018 - 20 | • | 1143 | 358.1 | 337.5 | 379.5 | 295.3 | 265.6 |
| 2019 - 21 | • | 1214 | 375.0 | 354.1 | 396.8 | 301.2 | 272.7 |
| 2020 - 22 | • | 1260 | 387.4 | 366.2 | 409.5 | 309.5 | 277.2 |
| 2021 - 23 | • | 1245 | 381.6 | 360.7 | 403.5 | 306.1 | 273.0 |
| 2022 - 24 | • | 1238 | 378.6 | 357.7 | 400.4 | 297.8 | 264.5 |
Source: OHID, based on Office for National Statistics data
Percentage of Deaths Occurring Prematurely
The percentage of deaths which occurred prior to the age of 75 years has been decreasing in the decade prior to the COVID-19 pandemic, although increased for deaths which were registered in 2021 (although the percentage was slightly lower in 2020 compared to 2019 for both men and women).
| Period of death registration | Males (% aged <75) | Females (% aged <75) | Persons (% aged <75) |
| 1996-98 | 52.6 | 33.8 | 42.9 |
| 1997-99 | 52.3 | 32.1 | 41.9 |
| 1998-00 | 53.1 | 31.7 | 42.2 |
| 1999-01 | 51.7 | 30.9 | 41.3 |
| 2000-02 | 50.6 | 30.2 | 40.2 |
| 2001-03 | 49.8 | 28.4 | 38.8 |
| 2002-04 | 49.2 | 29.3 | 38.8 |
| 2003-05 | 49.2 | 29.9 | 39.2 |
| 2004-06 | 48.7 | 31.1 | 39.6 |
| 2005-07 | 48.1 | 30.2 | 38.9 |
| 2006-08 | 48.1 | 30.8 | 39.3 |
| 2007-09 | 48.4 | 30.6 | 39.5 |
| 2008-10 | 49.0 | 30.8 | 39.9 |
| 2009-11 | 48.1 | 30.4 | 39.2 |
| 2010-12 | 45.9 | 30.0 | 37.8 |
| 2011-13 | 45.2 | 28.6 | 36.8 |
| 2012-14 | 44.9 | 28.4 | 36.5 |
| 2013-15 | 45.4 | 28.9 | 37.0 |
| 2014-16 | 45.1 | 30.1 | 37.6 |
| 2015-17 | 45.5 | 30.0 | 37.8 |
| 2016-18 | 45.3 | 29.3 | 37.4 |
| 2017-19 | 45.9 | 29.9 | 38.1 |
| 2018-20 | 45.4 | 30.1 | 38.0 |
| 2019-21 | 47.5 | 31.7 | 40.0 |
| 2020-22 | 48.3 | 32.0 | 40.6 |
| 2021-23 | 48.8 | 32.6 | 41.1 |
| 2022-24 | 48.8 | 33.0 | 41.4 |
Premature Deaths From Causes Considered to be Preventable
The directly standardised number of deaths per 100,000 population (standardised to the European Standard Population) for under 75 deaths considered preventable is the highest in the region, and is substantially higher than the national average.
The rate in Hull is fourth highest of lower-tier local authorities in England (out of 294) for deaths registered during 2022-24.
Compared with benchmark
| Indicator | Period | England | Yorkshire and the Humber region (statistical) | Kingston upon Hull | East Riding of Yorkshire | North East Lincolnshire | North Lincolnshire | York | North Yorkshire UA | Barnsley | Doncaster | Rotherham | Sheffield | Bradford | Calderdale | Kirklees | Leeds | Wakefield |
|---|---|---|---|---|---|---|---|---|---|---|---|---|---|---|---|---|---|---|
Under 75 mortality rate from causes considered preventable (Persons <75 yrs) | 2022 - 24 | 151.2 | 174.2 | 244.4 | 134.7 | 212.3 | 185.9 | 142.7 | 133.3 | 195.6 | 210.1 | 186.5 | 167.4 | 200.1 | 183.3 | 176.2 | 166.0 | 187.9 |
Under 75 mortality rate from causes considered preventable (Male <75 yrs) | 2022 - 24 | 200.2 | 228.0 | 327.4 | 179.9 | 281.1 | 243.1 | 190.7 | 179.0 | 255.9 | 271.5 | 236.0 | 219.8 | 263.4 | 236.9 | 228.5 | 213.6 | 237.4 |
Under 75 mortality rate from causes considered preventable (Female <75 yrs) | 2022 - 24 | 104.9 | 122.7 | 160.7 | 91.7 | 146.2 | 130.7 | 97.8 | 89.9 | 137.2 | 150.1 | 139.1 | 117.0 | 139.1 | 132.6 | 126.0 | 120.9 | 140.1 |
There were 1,440 deaths among those aged under 75 years from causes that were considered to be preventable over the three year periods prior to the COVID-19 pandemic in 2017-19. COVID-19 has been added as a preventable cause and accounts for a sizable percentage of the premature deaths from causes considered to be preventable (15% for males and 13% for females based on local analyses). However, it is also likely that there will be indirect impacts from COVID-19 in terms of mortality on other causes due to reduced and slower access to healthcare. In 2020-22, there were 1,768 deaths so a sizeable increase on the 1,440 deaths for 2017-19. However, the mortality rate has decreased in the last two years, 2021-23 with the year 2020 no longer part of the moving three-year average.
There were 7,976 deaths in total among Hull resident registered during 2022-24 including 3,302 (41%) of them that were among residents aged under 75 years. Overall, there were 1,603 deaths among those aged under 75 years that were from causes that were considered to be preventable equating to 49% of all premature deaths and 20% of all deaths.
In 2017-19 prior to the pandemic, there were 1,440 premature deaths from causes that were considered to be preventable, 2,932 premature deaths and 7,701 deaths in total. So in 2017-19, the premature deaths from causes considered to be preventable accounted for 49% of all premature deaths and 19% of all deaths.
Compared with benchmark
Under 75 mortality rate from causes considered preventable (Persons <75 yrs)
|
Period
|
Kingston upon Hull |
Yorkshire and the Humber region (statistical)
|
England
|
||||
|---|---|---|---|---|---|---|---|
|
Count
|
Value
|
95%
Lower CI |
95%
Upper CI |
||||
| 2001 - 03 | • | 1445 | 262.8 | 249.3 | 276.8 | 209.9 | 192.3 |
| 2002 - 04 | • | 1434 | 259.9 | 246.5 | 273.9 | 202.5 | 186.1 |
| 2003 - 05 | • | 1456 | 261.6 | 248.2 | 275.6 | 196.4 | 180.5 |
| 2004 - 06 | • | 1444 | 258.6 | 245.3 | 272.5 | 190.9 | 174.4 |
| 2005 - 07 | • | 1407 | 251.7 | 238.6 | 265.4 | 187.7 | 170.3 |
| 2006 - 08 | • | 1373 | 248.1 | 235.0 | 261.8 | 183.9 | 167.0 |
| 2007 - 09 | • | 1372 | 247.8 | 234.7 | 261.4 | 179.3 | 162.8 |
| 2008 - 10 | • | 1371 | 246.6 | 233.6 | 260.2 | 174.7 | 158.8 |
| 2009 - 11 | • | 1351 | 242.2 | 229.3 | 255.7 | 171.8 | 154.8 |
| 2010 - 12 | • | 1277 | 228.6 | 216.1 | 241.7 | 169.6 | 151.6 |
| 2011 - 13 | • | 1266 | 224.5 | 212.2 | 237.4 | 168.5 | 149.7 |
| 2012 - 14 | • | 1285 | 225.4 | 213.1 | 238.2 | 165.1 | 148.0 |
| 2013 - 15 | • | 1327 | 230.1 | 217.7 | 243.0 | 164.2 | 147.6 |
| 2014 - 16 | • | 1377 | 233.7 | 221.3 | 246.6 | 162.5 | 146.8 |
| 2015 - 17 | • | 1422 | 235.3 | 223.1 | 248.0 | 162.3 | 145.2 |
| 2016 - 18 | • | 1408 | 227.4 | 215.6 | 239.7 | 162.3 | 144.2 |
| 2017 - 19 | • | 1440 | 228.8 | 217.1 | 241.0 | 163.6 | 142.6 |
| 2018 - 20 | • | 1497 | 234.3 | 222.5 | 246.5 | 176.2 | 153.7 |
| 2019 - 21 | • | 1700 | 262.1 | 249.8 | 274.9 | 188.5 | 166.8 |
| 2020 - 22 | • | 1768 | 270.8 | 258.3 | 283.8 | 193.4 | 171.4 |
| 2021 - 23 | • | 1721 | 262.9 | 250.6 | 275.7 | 185.5 | 163.6 |
| 2022 - 24 | • | 1603 | 244.4 | 232.5 | 256.7 | 174.2 | 151.2 |
Source: OHID, based on Office for National Statistics data
Men were much more affected by COVID-19 with higher mortality rates both for all ages and among under 75s, and this is evident with the sharp increase in the mortality rates for 2018-20, 2019-21 and 2020-22. The mortality rate in 2020-22 was particularly high as this includes all deaths that were registered in 2020 and 2021 as well as the smaller number of COVID-19 deaths from 2022. However, there may have been other consequences of the pandemic which resulted in later diagnosis of some conditions which affected prognosis with the changes to access to healthcare at the height of the pandemic, and the increasing delays in accessing secondary care.
Among men, the premature mortality rate from causes considered to be preventable had reduced in Hull between 2001-03 and 2010-12, but remained relatively constant until the pandemic. In 2017-19, the mortality rate was 20% lower than it had been for 2001-03, but for 2022-24, the mortality rate is only 10% lower than it was in 2001-03.
In contrast, there has been a constant year-on-year decrease in the mortality rate for England (albeit with a smaller rate of decrease than Hull in the early part of the century) for the entire period prior to the pandemic. Additionally, the increase due to the pandemic was not quite as marked for England as it was for Hull (possibly because the differences in the economic profile meant more people could work from home and shield). The mortality rate in England in 2022-24 is 25% lower than it was in 2001-03.
Compared with benchmark
Under 75 mortality rate from causes considered preventable (Male <75 yrs)
|
Period
|
Kingston upon Hull |
Yorkshire and the Humber region (statistical)
|
England
|
||||
|---|---|---|---|---|---|---|---|
|
Count
|
Value
|
95%
Lower CI |
95%
Upper CI |
||||
| 2001 - 03 | • | 974 | 364.0 | 341.2 | 387.9 | 288.1 | 266.8 |
| 2002 - 04 | • | 944 | 350.9 | 328.6 | 374.4 | 277.1 | 257.4 |
| 2003 - 05 | • | 944 | 343.4 | 321.4 | 366.3 | 266.6 | 248.8 |
| 2004 - 06 | • | 936 | 336.5 | 314.9 | 359.2 | 259.2 | 239.8 |
| 2005 - 07 | • | 921 | 329.2 | 307.8 | 351.5 | 253.3 | 233.1 |
| 2006 - 08 | • | 913 | 331.4 | 309.8 | 354.0 | 247.9 | 227.4 |
| 2007 - 09 | • | 907 | 328.0 | 306.6 | 350.4 | 239.8 | 221.5 |
| 2008 - 10 | • | 899 | 325.7 | 304.3 | 348.1 | 232.4 | 215.5 |
| 2009 - 11 | • | 872 | 315.6 | 294.6 | 337.7 | 227.4 | 209.2 |
| 2010 - 12 | • | 801 | 289.4 | 269.3 | 310.5 | 224.4 | 203.7 |
| 2011 - 13 | • | 806 | 287.3 | 267.4 | 308.2 | 222.0 | 200.6 |
| 2012 - 14 | • | 804 | 283.1 | 263.5 | 303.8 | 217.1 | 197.9 |
| 2013 - 15 | • | 833 | 290.3 | 270.5 | 311.1 | 214.8 | 196.7 |
| 2014 - 16 | • | 868 | 294.6 | 274.9 | 315.2 | 212.8 | 194.8 |
| 2015 - 17 | • | 914 | 300.4 | 280.9 | 320.8 | 212.4 | 192.6 |
| 2016 - 18 | • | 917 | 294.1 | 275.2 | 314.0 | 211.8 | 191.4 |
| 2017 - 19 | • | 926 | 291.9 | 273.2 | 311.4 | 213.7 | 189.2 |
| 2018 - 20 | • | 974 | 303.5 | 284.6 | 323.3 | 230.8 | 204.4 |
| 2019 - 21 | • | 1143 | 351.2 | 331.0 | 372.3 | 247.1 | 221.3 |
| 2020 - 22 | • | 1191 | 363.7 | 343.2 | 385.1 | 252.4 | 227.2 |
| 2021 - 23 | • | 1162 | 353.9 | 333.7 | 374.9 | 241.4 | 216.3 |
| 2022 - 24 | • | 1078 | 327.4 | 308.0 | 347.7 | 228.0 | 200.2 |
Source: OHID, based on Office for National Statistics data
For women, the trends over time in the premature mortality rate from causes considered to be preventable is slightly different to that observed for men, with no real change over time, although there is considerable year-on-year variability. The increase in the mortality rates due to the pandemic is apparent for England, but less so for Hull as the increase appears to fall within the bounds of the variability observed over the whole time period.
In contrast, prior to the pandemic, the mortality rate in England had consistently shown an annual decrease, and even with the increased mortality due to the pandemic, the mortality rate in England is lower in 2022-24 than it was in 2001-03 by 15%. This is not the case for Hull, where the mortality rate for 2022-24 is only 3% lower compared to the rate in 2001-03 for Hull women. However, it should be noted that the rate in 2001-03 was relatively low being around the fifth lowest in the last 21 three-year periods.
Compared with benchmark
Under 75 mortality rate from causes considered preventable (Female <75 yrs)
|
Period
|
Kingston upon Hull |
Yorkshire and the Humber region (statistical)
|
England
|
||||
|---|---|---|---|---|---|---|---|
|
Count
|
Value
|
95%
Lower CI |
95%
Upper CI |
||||
| 2001 - 03 | • | 471 | 166.2 | 151.4 | 182.0 | 138.0 | 123.2 |
| 2002 - 04 | • | 490 | 172.9 | 157.8 | 189.0 | 133.9 | 119.7 |
| 2003 - 05 | • | 512 | 182.0 | 166.4 | 198.6 | 131.3 | 116.6 |
| 2004 - 06 | • | 507 | 182.0 | 166.4 | 198.7 | 127.2 | 113.1 |
| 2005 - 07 | • | 485 | 175.5 | 160.1 | 191.9 | 126.1 | 111.1 |
| 2006 - 08 | • | 460 | 166.8 | 151.8 | 182.9 | 123.7 | 109.9 |
| 2007 - 09 | • | 464 | 169.1 | 154.0 | 185.3 | 122.2 | 107.1 |
| 2008 - 10 | • | 472 | 169.5 | 154.4 | 185.6 | 120.0 | 105.0 |
| 2009 - 11 | • | 478 | 170.9 | 155.8 | 187.1 | 119.1 | 103.0 |
| 2010 - 12 | • | 476 | 169.4 | 154.4 | 185.5 | 117.6 | 102.2 |
| 2011 - 13 | • | 460 | 163.1 | 148.4 | 178.8 | 117.4 | 101.3 |
| 2012 - 14 | • | 481 | 168.7 | 153.8 | 184.6 | 115.5 | 100.6 |
| 2013 - 15 | • | 494 | 171.3 | 156.4 | 187.3 | 115.7 | 100.8 |
| 2014 - 16 | • | 509 | 173.6 | 158.7 | 189.6 | 114.3 | 101.1 |
| 2015 - 17 | • | 508 | 170.3 | 155.6 | 185.8 | 114.1 | 100.1 |
| 2016 - 18 | • | 490 | 160.2 | 146.2 | 175.1 | 114.6 | 99.2 |
| 2017 - 19 | • | 514 | 164.9 | 150.9 | 179.8 | 115.4 | 98.1 |
| 2018 - 20 | • | 523 | 164.4 | 150.6 | 179.2 | 123.6 | 105.5 |
| 2019 - 21 | • | 557 | 172.8 | 158.7 | 187.8 | 132.3 | 115.2 |
| 2020 - 22 | • | 577 | 177.8 | 163.6 | 193.0 | 137.0 | 118.5 |
| 2021 - 23 | • | 559 | 171.7 | 157.7 | 186.6 | 132.0 | 113.8 |
| 2022 - 24 | • | 524 | 160.7 | 147.2 | 175.2 | 122.7 | 104.9 |
Source: OHID, based on Office for National Statistics data
Number of Premature Deaths Considered to be Preventable by Cause of Death
It is possible to examine the top causes of death among the premature deaths from causes considered preventable from the local mortality data (same causes examined previously but ignoring the ‘other’ categories).
Among the 1,078 premature deaths from causes considered to be preventable among males, the top causes were as follows with the average number of deaths per year registered during 2022-24 given in brackets:
- Coronary heart disease (65)
- Lung cancer (47)
- Chronic obstructive pulmonary disease (37)
- Drug poisoning (36)
- Alcohol-specific (32)
- Suicide and undetermined injury (25)
- COVID-19 (10)
- Oesophagus cancer (10)
Around one-quarter of premature male deaths from causes considered to be preventable were due to cancer (25.8%), 25.2% due to drug poisoning, alcohol-specific conditions and/or suicide and undetermined injury, 22.5% due to cardiovascular disease and 11.4% due to respiratory disease. There were 31 males deaths from COVID-19 over the three year period which was 2.9% of the total preventable deaths. Overall, there were 260 from external causes over the three year period representing 24.1% of all premature deaths from causes considered to be preventable.
Among the 524 premature deaths from causes considered to be preventable among females, the top causes were as follows with the average number of deaths per year registered during 2022-24 given in brackets:
- Lung cancer (40)
- Chronic obstructive pulmonary disease (33)
- Coronary heart disease (18)
- Drug poisoning (12)
- Alcohol-specific (11)
- Suicide and undetermined injury (9)
- Stroke (9)
- COVID-19 (5)
More than one-third of premature female deaths from causes considered to be preventable were due to cancer (36.3%), 17.2% due to drug poisoning, alcohol-specific conditions and/or suicide and undetermined injury, 16.5% due to cardiovascular disease and 20.4% due to respiratory disease. There were 16 deaths from COVID-19 over the three year period which was 3.0% of all preventable deaths. Overall, there were 76 deaths from external causes over the three year period representing 15.1% of all premature deaths from causes considered to be preventable.
In the period 2020-22 which included the higher mortality rate from COVID-19, there were 174 male and 77 female premature deaths from COVID-19 that were considered to be preventable which represented 15% and 13% of all premature deaths from causes considered to be preventable. COVID-19 was to top cause of premature deaths considered to be preventable among men for deaths registered during 2020-22 and third highest cause for women after lung cancer and chronic obstructive pulmonary disease.
Mortality Rates Across Hull’s Electoral Wards
Premature Deaths
The mortality rates and causes of death differ substantially across the 21 wards in Hull.
For deaths registered during the 2022-24, the directly standardised mortality rates per 100,000 persons (standardised to the European Standard Population) for all under 75 deaths varies between 262 and 838 deaths per 100,000 population across Hull’s 21 electoral wards. The under 75 year age standardised mortality rates are 3.2 times higher in Central ward than they are in Kingswood ward.
There is a strong association with deprivation. Kingswood, Holderness and Bricknell are the three least deprived wards in Hull and they have the lowest mortality rates. Marfleet, St Andrew’s & Docklands, Orchard Park and Central are the four most deprived wards in Hull and they have among the highest premature mortality rates.
The premature mortality rates for people living in Central, Newington & Gipsyville, St Andrew’s & Docklands, Marfleet, and Orchard Park are all statistically significantly higher than the Hull average, whereas the premature mortality rates for Kingswood, Holderness, Bricknell, West Carr, Derringham and Ings are all statistically significantly lower than the Hull average.
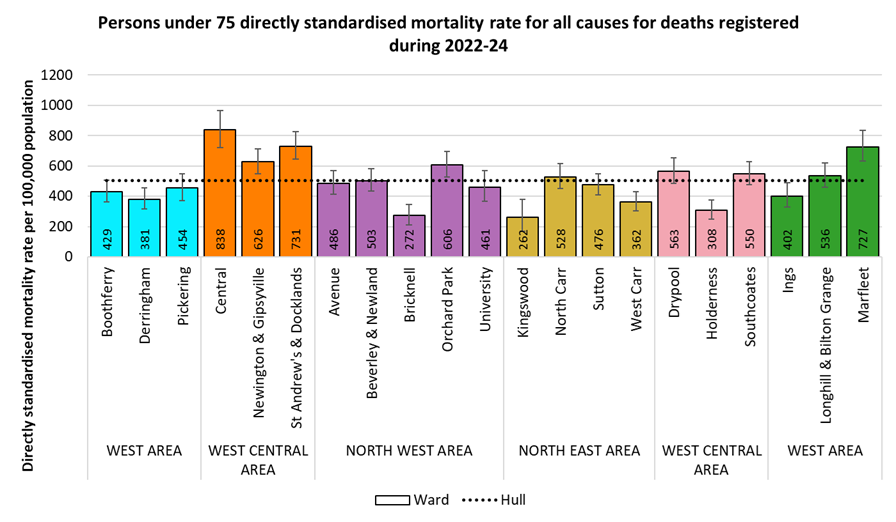
The pattern is very similar across the wards for men with the mortality rates with age standardised premature mortality rates ranging from 308 to 979 deaths per 100,000 population across Hull’s wards for deaths registered during 2022-24. The premature mortality for men living in Central ward is almost 3.2 times higher than for men living in Bricknell.
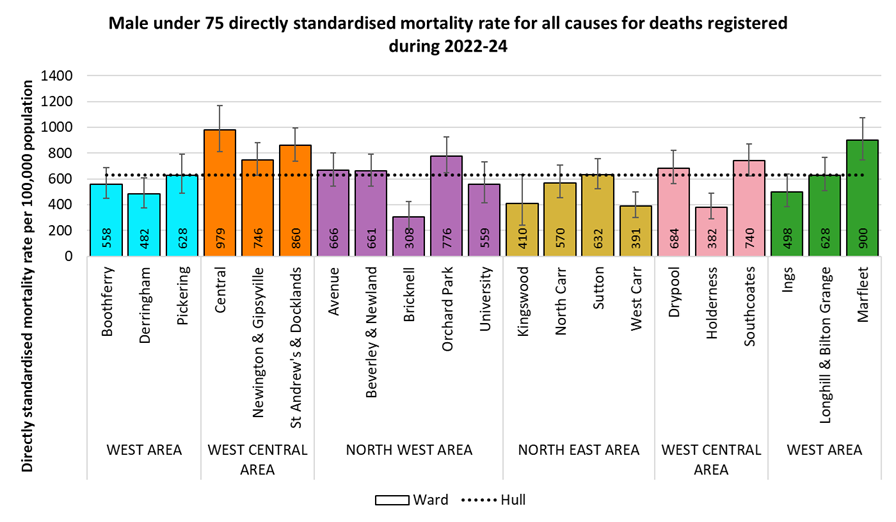
A very similar pattern in the premature mortality rates occurs for women across Hull’s wards with mortality rates ranging from 134 to 674 deaths per 100,000 population for deaths registered during 2022-24. Female premature mortality rates are 5 times higher in Central than they are in Kingswood.
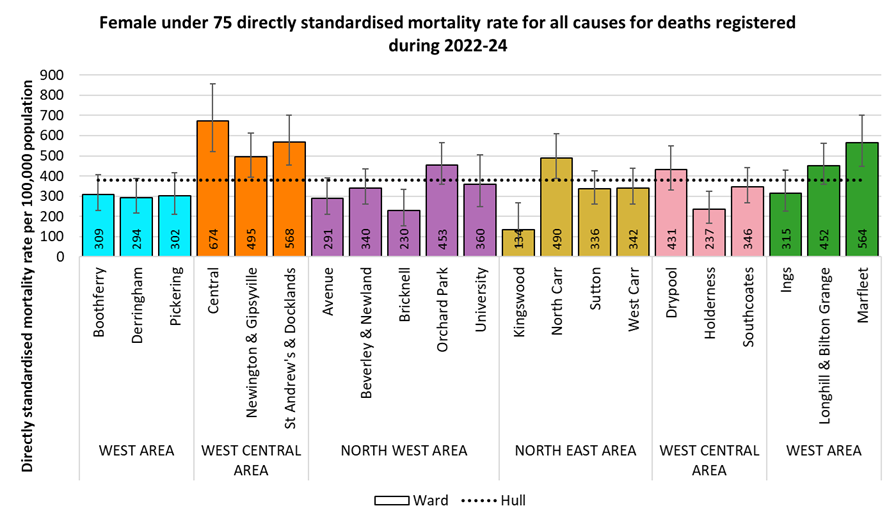
More information is also available in within our Ward Profiles under Place.
Premature Deaths from Causes Considered to be Preventable
For deaths registered during 2022-24, the directly standardised mortality rates per 100,000 persons (standardised to the European Standard Population) for all under 75 deaths from causes considered preventable also varies significantly across Hull’s 21 electoral wards.
There is an almost four-fold difference in the standardised mortality rates across the wards with a mortality rate of 108 per 100,000 population for Bricknell compared to 420 per 100,000 population for Central.
Premature mortality rates from causes considered to be preventable are statistically significantly higher than the Hull average for residents of Central, St Andrew’s & Docklands, Marfleet, Orchard Park and Newington & Gipsyville.
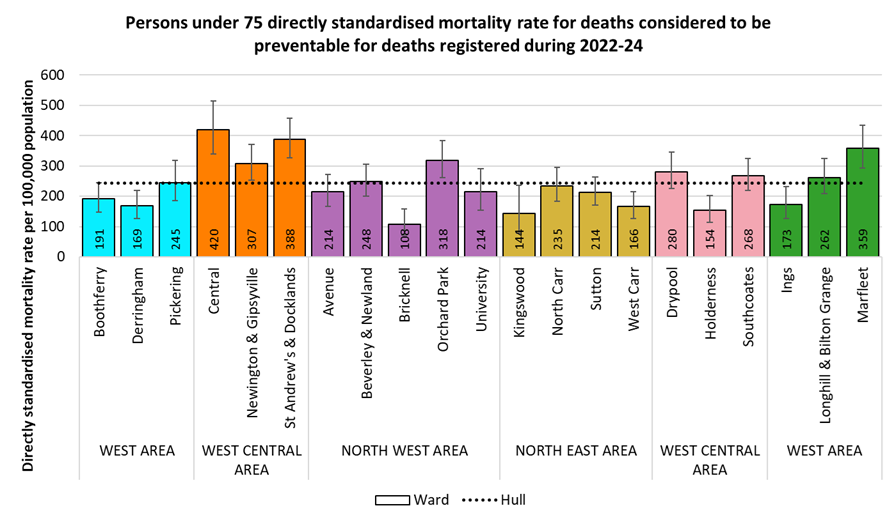
There is a similar pattern for men with the premature mortality rate from causes considered preventable ranging from 153 per 100,000 population in Bricknell to 513 per 100,000 population in Central.
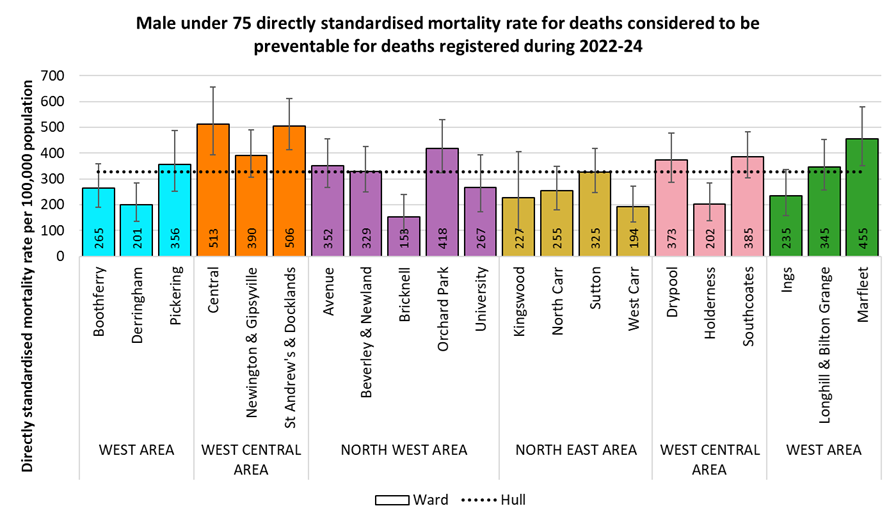
For women, the mortality rates range from 67 to 314 per 100,000 population with Avenue having the lowest rate and Central having the highest rate. There were fewer than 10 premature deaths from causes considered preventable in Bricknell and Kingswood, and it is not possible to produce a statistically robust estimate of the mortality rate with fewer than ten deaths across all age groups.
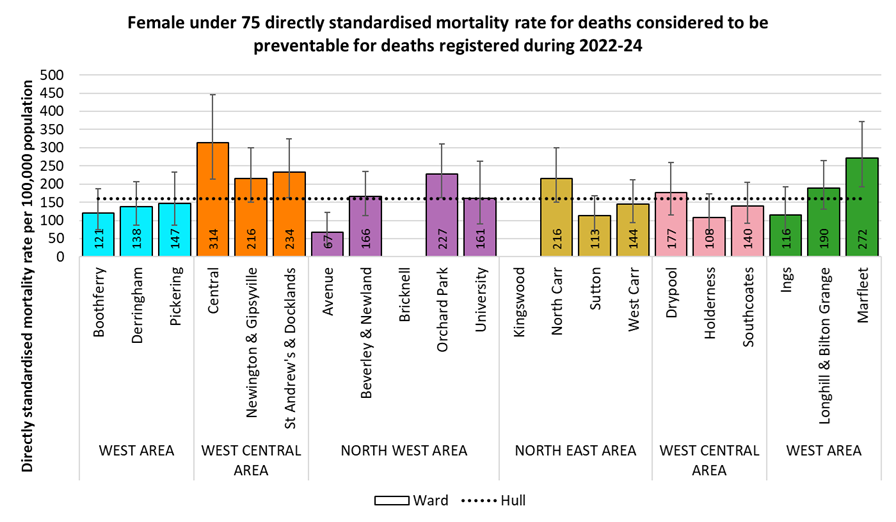
Mortality Rates By Local Deprivation Fifth
Premature Deaths
As noted above across the wards, there is a strong association between premature mortality and deprivation.
For deaths registered during 2022-24, the directly standardised mortality rates per 100,000 persons (standardised to the European Standard Population) for all under 75 deaths ranges from 271 deaths per 100,000 population for people living in the least deprived fifth of areas of Hull to 715 deaths per 100,000 population for people living in the most deprived fifth of areas of Hull. The mortality rate in the most deprived fifth of areas of Hull is around 2.6 times higher than the age standardised premature mortality rate of those living in the least deprived fifth of areas of Hull.
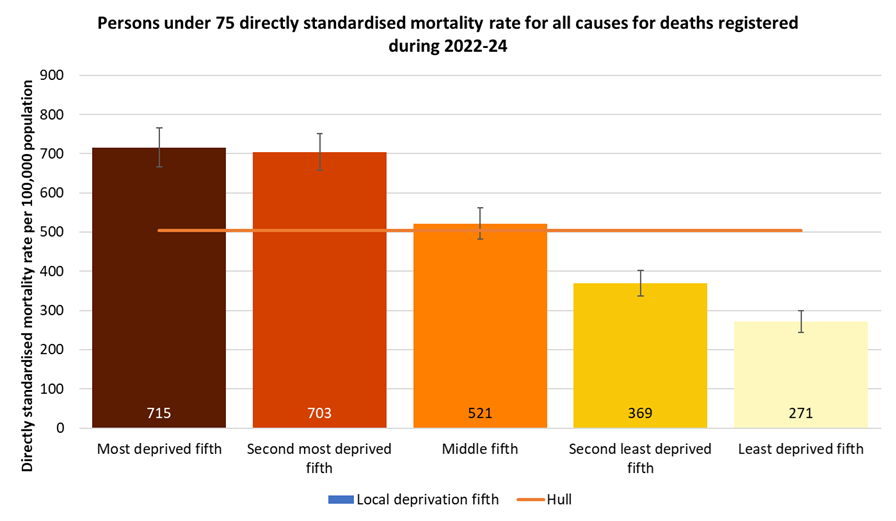
Mortality rates are higher among men, but a very similar pattern occurs. The premature mortality rate is 329 per 100,000 population among men living in the least deprived fifth of areas of Hull compared to 843 and 867 per 100,000 population among men living in the most deprived and second most deprived fifths of areas of Hull, so around 2.6 times higher for men living in the two most deprived fifths of Hull compared with men living in the least deprived fifth of areas. .
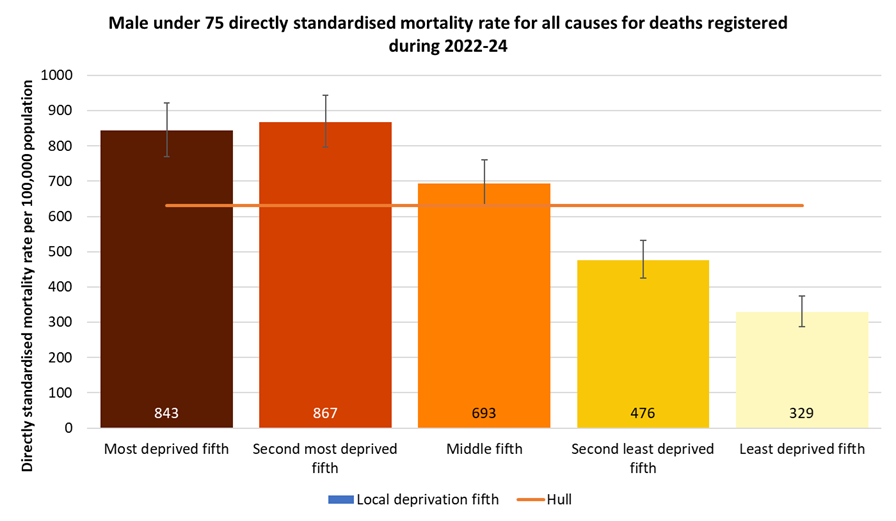
Among women, the mortality rate in the most deprived fifth of areas of Hull is also around 2.7 times the age standardised premature mortality rate of those living in the least deprived fifth of areas of Hull with the mortality rate ranging from 215 to 586 per 100,000 population across the deprivation fifths for premature deaths registered during 2022-24.
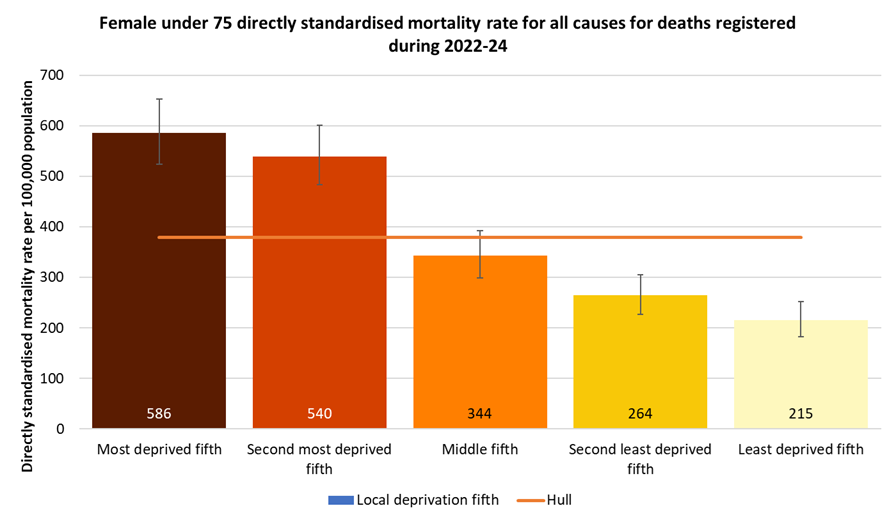
More information is also available in within our Ward Profiles under Place.
Premature Deaths from Causes Considered to be Preventable
For deaths registered during 2022-24, the directly standardised mortality rates per 100,000 persons (standardised to the European Standard Population) for all under 75 deaths from causes considered preventable also varies significantly across Hull based on the Index of Multiple Deprivation local fifths.
For men and women combined, the premature mortality rate from causes considered preventable was 2.8 times times higher in the most deprived fifth of areas of Hull (369 deaths per 100,000 population) compared to the least deprived fifth of areas of Hull (130 deaths per 100,000 population).
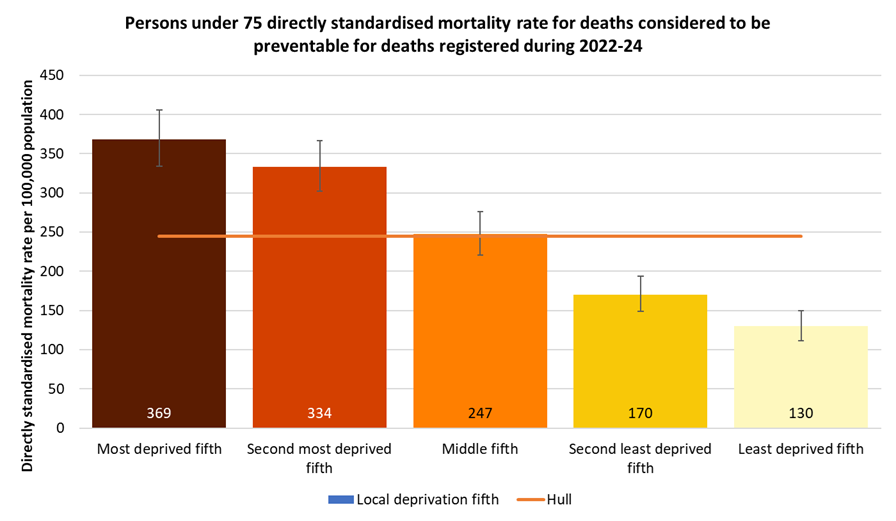
A similar pattern was observed for men with the premature mortality rate from causes considered to be preventable ranging from 178 deaths per 100,000 population for people living in the least deprived fifth of areas of Hull to 474 deaths per 100,000 population for people living in the most deprived fifth of areas of Hull.
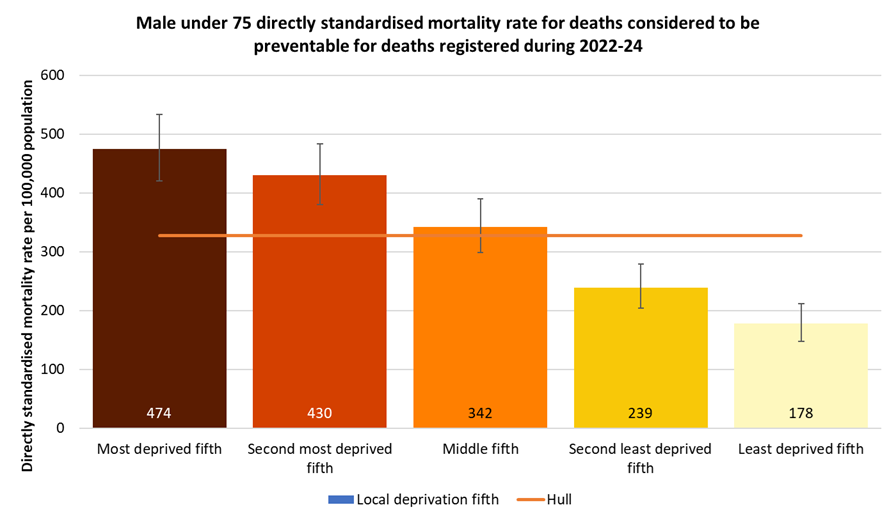
For women, the premature mortality rate from causes considered to be preventable ranged from 84 deaths per 100,000 population for people living in the least deprived fifth of areas of Hull to 264 deaths per 100,000 population for people living in the most deprived fifth of areas of Hull.
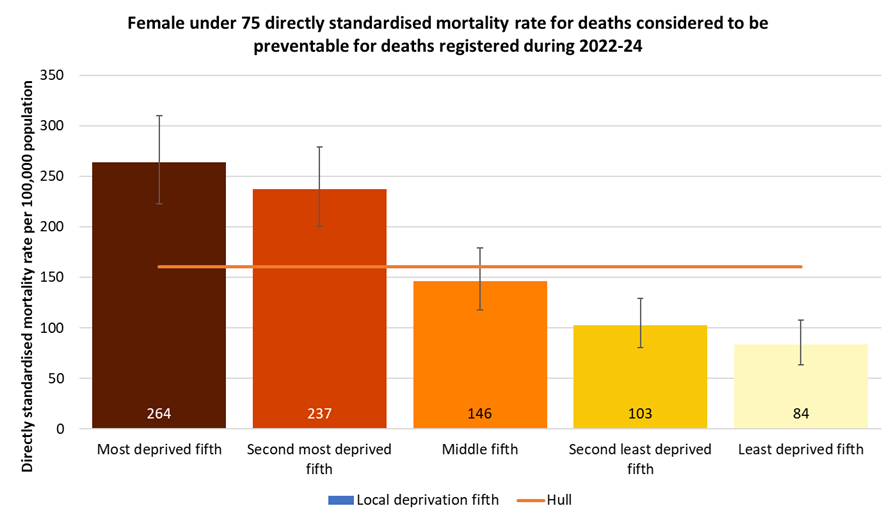
Strategic Need and Service Provision
Whilst reducing the number of deaths and increasing life expectancy is important, this needs to be achieved in conjunction with improvements in the quality of life. This is particularly so with the ageing population and the increased demand on scarce resources.
Health inequalities is a huge issue in Hull with large differences in the number of premature and preventable deaths across different geographical areas in Hull. Inequalities are also present in many other areas such as those associated with education, economic activity, lifestyle and behaviour risk factors, housing, social, etc. There is considerable work already occurring in Hull to address these inequalities, but there is still a long way to go with mortality and life expectancy inequalities tending to increase rather than reduce. COVID-19 has impacted greatly on mortality and increased inequalities in Hull.
Resources
Office for Health Improvement & Disparities’ Fingertips: https://fingertips.phe.org.uk/
Updates
This page was last updated / checked on 2 March 2026.
This page is due to be updated / checked in September 2026.