Index
This topic area covers statistics and information relating to population projections in Hull including local strategic need and service provision. Further information relating to current Population Estimates including Race and Ethnicity are given within Population, and information relating to Housing including household structure is given within Health and Wellbeing Influences.
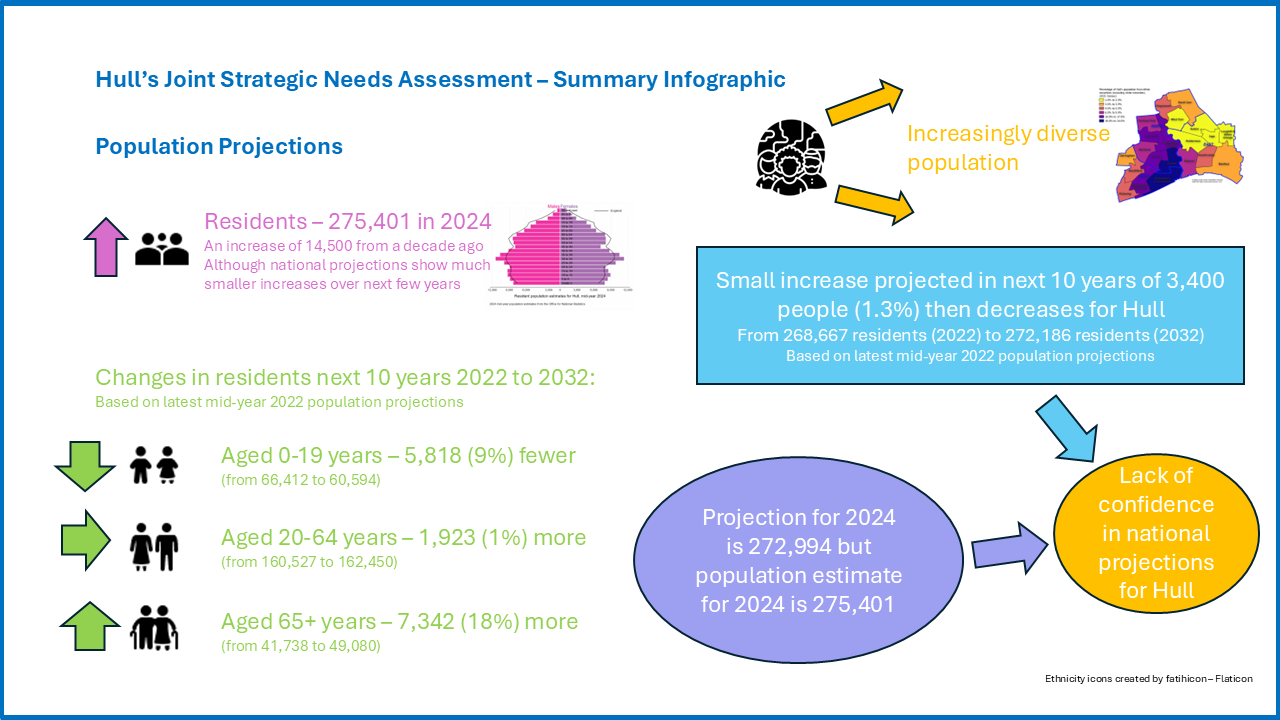
Summary Infographic
Headlines
- It is essential for planning to understand the current population and future population numbers. This is not only in planning health care for older people which we know are projected to increase over time, but also for planning for other health needs associated with infants, children, maternity services, etc. as well as broader needs such as those associated with pre-school, education, employment and housing.
- The Office for National Statistics (ONS) produce population projections every two years (although with a gap in 2020 due to COVID-19) with the latest based on the mid-year population estimates for 2022.
- From the 2022-based population projections, it was projected that Hull’s population would increase from 268,700 in 2022 to 272,500 by 2027 (an increase of 1.4%), but would then fall very slightly in subsequent years to 271,100 by 2047 (an increase of 0.9% from 2022).
- This masked substantial differences across the age groups. It was projected that the number of people aged 0-9, 10-19, 30-39 and 50-59 would decline in Hull between 2022 and 2032 with increases for all other age groups particularly among those aged 80-84 years where there would be an increase of around 35% (due to the post-World War II baby boom).
- However, based on the 2022-based population projections for Hull, it was estimated that the population in 2024 would be around 272,994, but the mid-year 2024 population estimates for Hull are 275,401 which is 0.9% higher than the projected population. This does cast doubt on the validity of the estimates for Hull.
- Rising numbers of elderly and very elderly people will mean rising demand for a wide range of services which meet their needs. Not only are people living longer on average, but elderly people are living with an increasing number of chronic diseases which have implications for their health and care needs.
- In the last ten years between 2014 and 2014, the percentage of the population in the older ages (80+ years and 90+ years) has not increased significantly. However, from the 2024 population estimates, there are just over 2,200 residents aged 77 years in Hull (born 1946-47), but there are only just under 1,200 residents aged 80 years (born 1943-44). Thus in the next 2-3 years, these residents will reach the age of 80+ years which marks a significant step up in numbers with a continued increase with the increased birth rate following World War II compared to the World War II period (1939-45).
The Population Affected – Why Is It Important?
People at different ages and stages of their lives have different health needs. Thus in order to improve health and wellbeing, and reduce inequalities of the people living in Hull, it is essential to understand the population to determine current and future health needs so planning can take into account differences and changes over time. Those in the oldest age groups have the greatest health need and it is these age groups where it is projected that the largest relative increases will occur in the population due to advances in health care and people living longer.
The Hull Picture
The Office for National Statistics (ONS) generally produce population projections every two years with the latest based on the mid-year population estimates for 2022, released on 25 June 2025. The previous population projections were based on the mid-year 2018 population estimates, so it is some time since population estimates have been released at local authority level.
Based on the 2022-based population projections for Hull, it was estimated that the population in 2024 would be around 272,994, but the mid-year 2024 population estimates for Hull are 275,401 which is 0.9% higher than the projected population. This does cast doubt on the validity of the estimates for Hull.
Population Projections for Hull
From the 2022-based population projections, ONS estimated that there were 268,700 residents in Hull, and they projected that this would increase to 272,500 by 2027 (an increase of 1.4%), before then decreasing slightly in subsequent years to reach 271,100 by 2047 (an increase of 0.9% on 2022, but a decrease of 0.5% from 2027).
| Age | 2022 | 2027 | 2032 | 2037 | 2042 | 2047 |
| 0-4 | 15,800 | 14,200 | 13,600 | 13,300 | 13,300 | 13,100 |
| 5-9 | 17,100 | 15,500 | 13,900 | 13,400 | 13,200 | 13,100 |
| 10-14 | 17,300 | 16,800 | 15,200 | 13,700 | 13,200 | 13,000 |
| 15-19 | 16,200 | 18,500 | 17,900 | 16,400 | 15,000 | 14,500 |
| 20-24 | 18,100 | 20,400 | 22,100 | 21,400 | 20,100 | 18,700 |
| 25-29 | 20,200 | 17,900 | 18,400 | 19,800 | 19,400 | 18,300 |
| 30-34 | 21,400 | 21,300 | 19,000 | 19,500 | 20,900 | 20,400 |
| 35-39 | 19,300 | 21,200 | 20,700 | 19,000 | 19,400 | 20,700 |
| 40-44 | 16,600 | 18,600 | 20,100 | 19,800 | 18,300 | 18,700 |
| 45-49 | 15,600 | 16,000 | 17,700 | 19,200 | 18,900 | 17,700 |
| 50-54 | 17,000 | 14,900 | 15,200 | 16,900 | 18,300 | 18,100 |
| 55-59 | 17,000 | 16,000 | 14,100 | 14,400 | 16,000 | 17,400 |
| 60-64 | 15,300 | 15,900 | 15,000 | 13,200 | 13,600 | 15,100 |
| 65-69 | 12,600 | 14,000 | 14,700 | 13,900 | 12,200 | 12,700 |
| 70-74 | 10,900 | 11,100 | 12,500 | 13,100 | 12,600 | 11,100 |
| 75-79 | 8,200 | 9,100 | 9,300 | 10,600 | 11,300 | 10,900 |
| 80-84 | 5,100 | 6,200 | 6,800 | 7,100 | 8,300 | 8,900 |
| 85-89 | 3,300 | 3,000 | 4,000 | 4,400 | 4,700 | 5,600 |
| 90+ | 1,700 | 1,800 | 1,800 | 2,400 | 2,800 | 3,100 |
| All | 268,700 | 272,500 | 272,100 | 271,700 | 271,400 | 271,100 |
Over the shorter term to 2032, ONS project a decrease of 16.4% among the 0-9 year age group and a 13.8% decrease among the 50-59 year age group. Small decreases were also projected for the 10-19 and 30-39 age groups of 1.3% and 2.3% respectively. Increases are projected for all other age groups, with the largest increases seen in the 80-89 year age group (30.8%), the 40-49 year age group (17.5%) and the 70-79 year age group (13.7%). Increases of 6.7%, 5.6% and 3.2% were seen respectively for the 60-69, 20-29 and 90+ years age groups. These mask relatively large individual changes within five year age groups such as an increases of 35.4%, 23.7%, 21.2%, 21.9%, 16.7% and 14.3% among those aged 80-84, 85-89, 40-44, 20-24, 65-69 and 70-74 years respectively, and decreases of 18.4%, 17.4%, 14.2%, and 12.3% among those aged 5-9, 55-59, 0-4 and 10-14 years respectively.
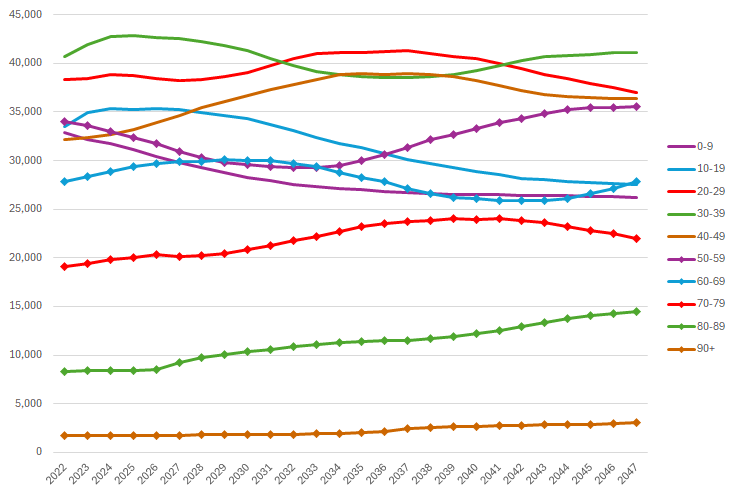
Over the longer term to 2047, ONS project decreases of 20.3%, 17.9% and 3.4% among those aged 0-9, 10-19 and 20-39 years respectively, and increases of 14.7%, 74.8% and 75.0% among those aged 70-79, 80-89 and 90+ years respectively.
Among those aged 65+ years, it is projected that Hull’s population will increase by 17.6% by 2032 (from 41,700 in 2022 to 49,100 in 2032) and by 25.1% by 2047 (to 52,200). Among those aged 85+ years, it is projected that the population will increase by 16.5% from 5,000 in 2022 to 5,800 in 2032, but by 72.6% to 8,600 in 2047.
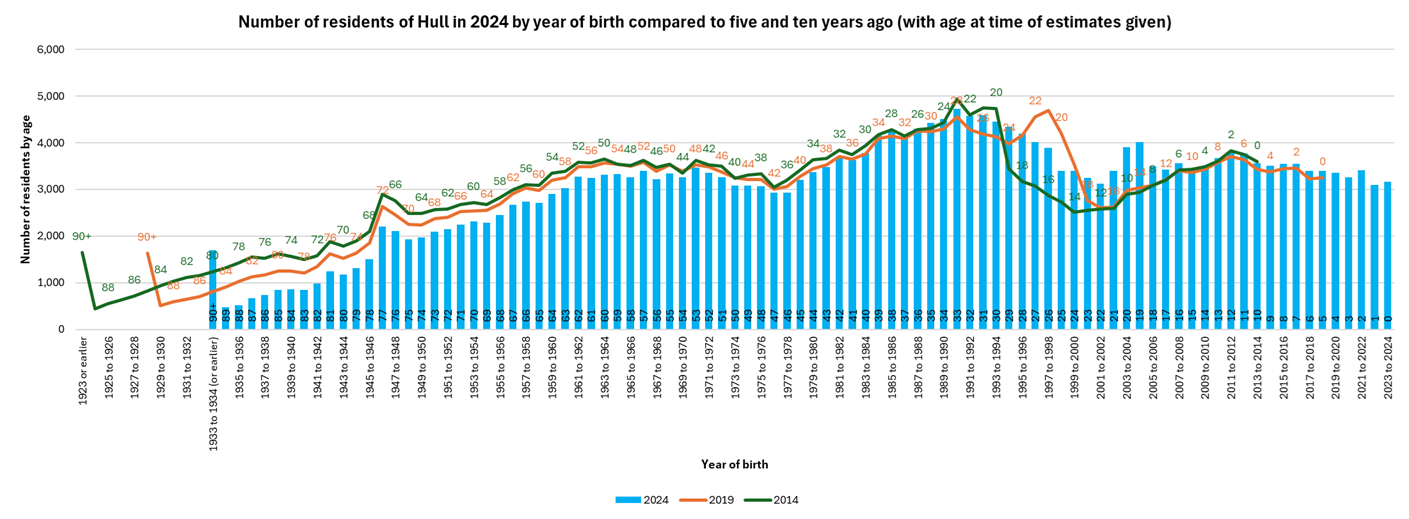
The population estimates for 2024 are compared with the population estimates from five years ago in 2019 and from ten years ago in 2014 to further examine the change in Hull’s population.
The most notable differences occur in the younger age groups. For example, in 2014, there were 2,585 residents aged 12 years in Hull, but in 2019 this had increased to 3,206 residents and increased further for 2024 to reach 3,790. This pattern also occurred for other teenage years, although there were differing patterns among older teenagers and those in their early 20s. In 2014, there were 3,164 residents aged 18 years compared to 2,754 in 2019 and 3,488 in 2024. In 2014, there were 3,444 residents aged 19 years compared to 3,536 in 2019 and 4,016 in 2024, and in 2014, there were 4,737 residents aged 20 years compared to 4,202 in 2019 and 3,900 for 2024. Thus there was a larger increase in the population aged 20 years compared to 19 years in 2014 compared to 2019 and 2024. It is likely that this is associated with the intake for the University and higher educational establishments in Hull as well as the locations of University halls of residents (some were/are physically located in East Riding of Yorkshire).
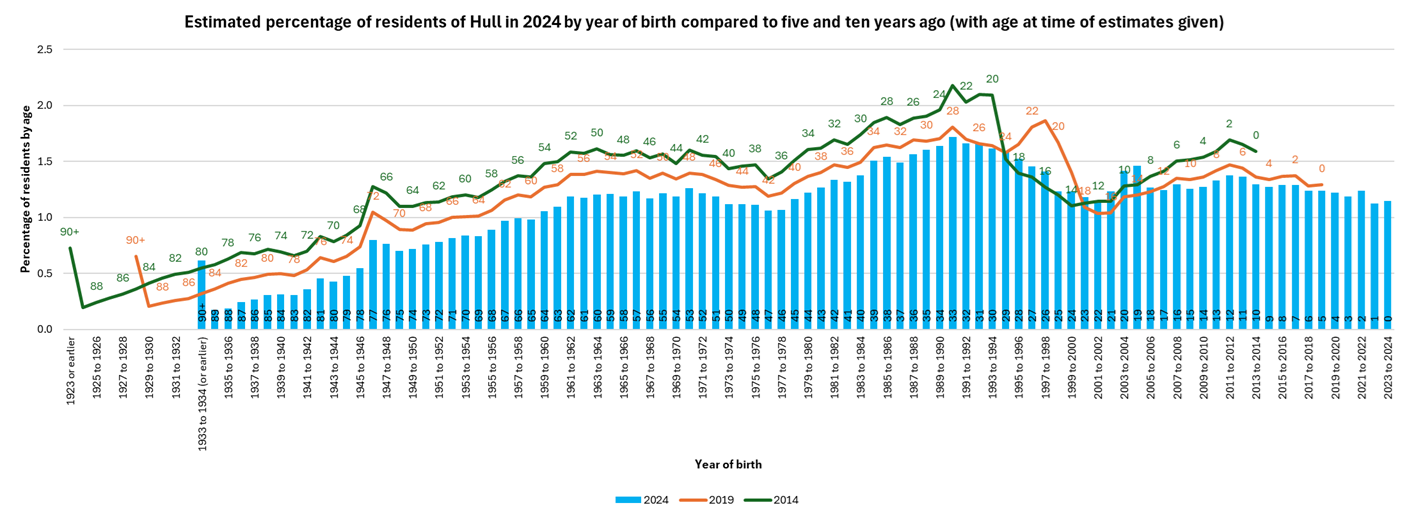
Despite the premise of an ageing population, the total numbers aged 80+ years and 90+ years has remained relatively unchanged in Hull over the last ten years with relatively minor increases. However, the numbers aged 80+ years is due to increase in the next five years as the post World War II baby boom in population reaches 80 years of age. There is a relatively sharp step up in the population numbers. For instance in 2024, it is estimated that there is 2,203 residents aged 77 years (born 1946-47), but only 1,178 residents aged 80 years (born 1943-44).
The percentage of the total population by single year of age is given below for 2024 compared to 2019 and 2014.
More Detailed Report
The following report provides more information on the mid-2022 based population projections for Hull.
Strategic Need and Service Provision
Rising numbers of elderly and very elderly people will mean rising demand for a wide range of services which meet the needs of elderly people. Not only are people living longer on average, but elderly people are living with an increasing number of chronic diseases which have implications for their health and care needs. In the absence of other changes, the 25% increase in over 65s in Hull over the next 25 years will likely mean an even larger increase in demand for services.
Resources
ONS population projections: https://www.ons.gov.uk/peoplepopulationandcommunity/populationandmigration/populationprojections
Updates
This page was last updated / checked on 16 January 2026.
This page is due to be updated / checked in July 2027.