Index
This topic area covers statistics and information relating to veterans in Hull including local strategic need and service provision.
Headlines
- The Veterans’ Survey 2022 was a collaboration between the Office for National Statistics (ONS), The Office for Veterans’ Affairs (who funded the survey), and the devolved administrations. It aimed to understand the experiences of veterans and their families. In total there were 28,957 veteran respondents.
- The first results of the survey were published on 4 December 2024, covering the health and wellbeing of veterans, then on 10 January 2025 covering finance and housing and then on 23 April 2025 concerning employment. Further analysis will be published throughout 2025.
- The 2021 Census in England and Wales was the first to ask people if they had previously served in the UK armed forces, and 4.7% of Hull’s population aged 16+ years recorded that they were veterans – 10,079 people. The percentage in Hull is higher than the Yorkshire and the Humber region (4.2%) and England and Wales (3.8%).
- Overall, 8.2% of 16+ aged males in Hull identified as veterans, whilst only 1.3% of 16+ aged females did so. Whilst 1.0% of aged 16 to 24 years males in Hull identified as being a veteran, this increased considerably to 21.5% for those aged 65 years and over.
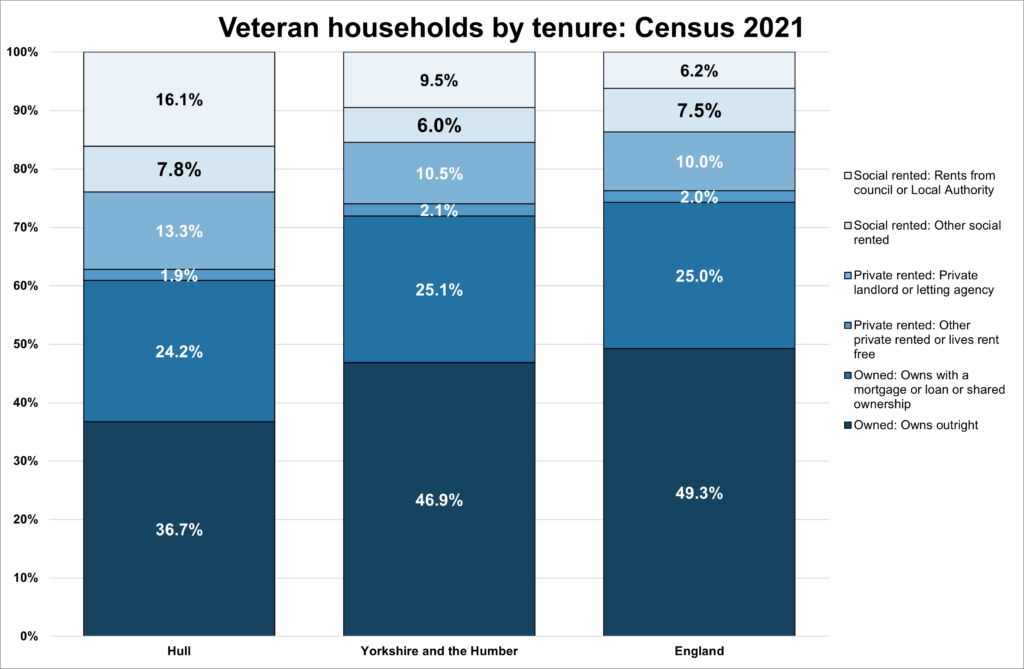
- In Hull, if you are a veteran, you are more likely to live in rented accommodation whether social rented accommodation (owned by the local authority or another body) or privately owned, than compared with the Yorkshire and the Humber region and England averages.
- Veterans below the age of 65 are more likely to be economically active than compared to non-veterans.
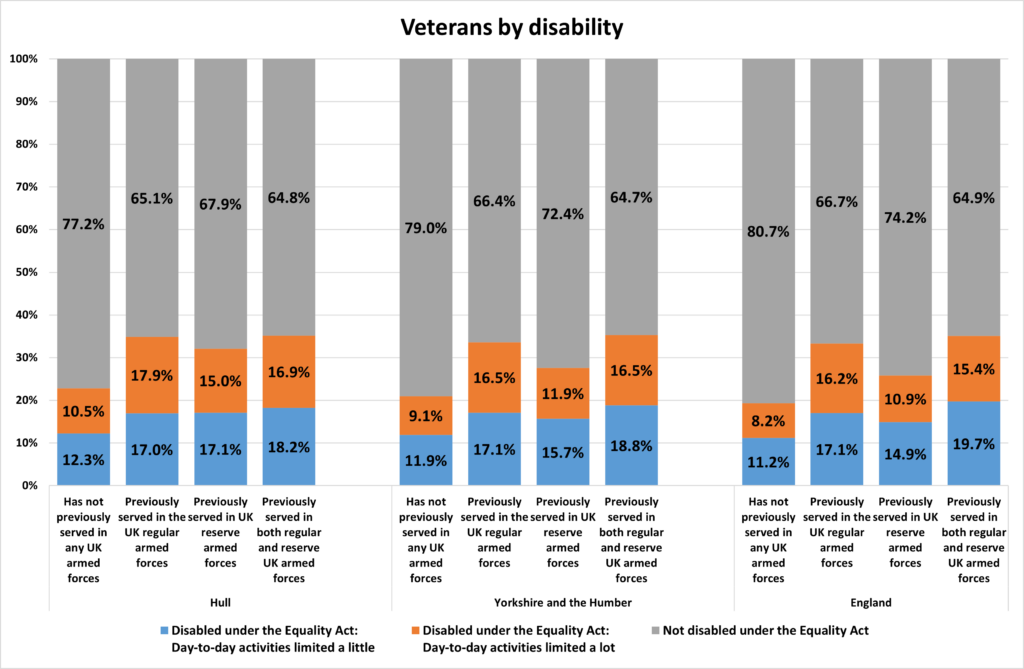
- Veterans are more likely to be disabled than non-veterans. For those Hull residents who have previously served in the UK regular armed forces, 34.9% have a disability that comes under the Equality Act, whilst for the Yorkshire and the Humber region this figure is 33.6% and nationally the figure is 33.3%. Those Hull residents who have not previously served in any UK armed forces 22.8% have a disability which comes under the Equality Act, compared with 21.0% in the Yorkshire and the Humber region and 19.4% nationally.
- In 2022, there were 3,740 people and their dependents recorded as veterans on the clinical systems of Hull’s GPs – this would appear to be significant under-recording.
- Self-reported general health is generally similar for similar-aged veterans compared to non-veterans, although more veterans report long-lasting health problems.
- A survey conducted across Hull in 2017 identified mental health, employment and employability, and housing as priorities for Hull’s veterans and their families. This was reinforced by a further survey in 2022.
The Population Affected – Why Is It Important?
A veteran is defined as anyone who has served for at least one day in Her Majesty’s Armed Forces (Regular or Reserve) or Merchant Mariners who have seen duty on legally defined military operations. A service leaver is a term for someone who is in transition from or has ceased to be a member of HM Armed Forces. The term service leaver is typically used in legal documents, as understanding and use of the term veteran does vary, and not least among those who have served. Many former Armed Forces personnel in the UK do not define themselves as a veteran.
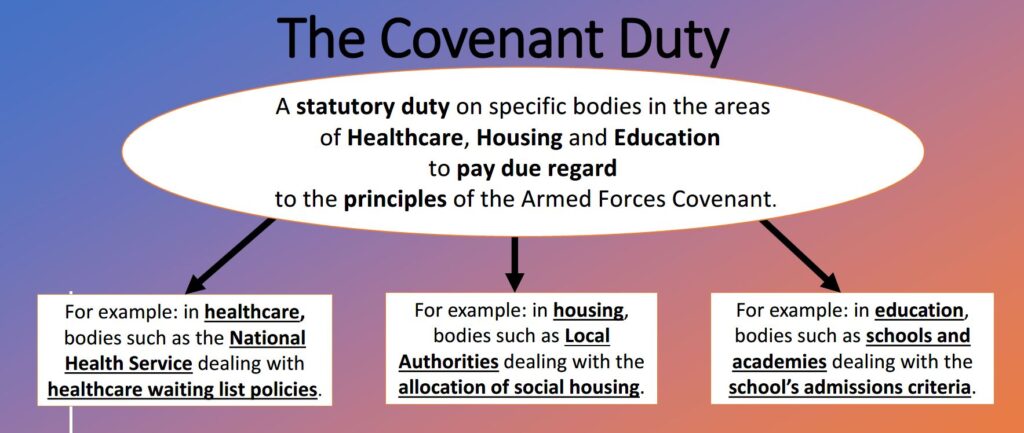
The Armed Forces Act 2021 introduced a new requirement for some public bodies, local authorities, and the NHS, to pay due regard to the principles of the Armed Forces Covenant when carrying out specific public functions in the areas of housing, healthcare and education. This came into force on 22 November 2022. The new legislation aims to prevent service personnel, veterans and their families from being disadvantaged when accessing essential services.
Some veterans have specialist health care needs, and this could be either in relation to physical health care needs, or mental health care needs, or both.
Medical services are delivered to servicemen and women by the Ministry of Defence, the NHS, charities and welfare organisations, and all serving personnel receive their mental health care through the Ministry of Defence commissioned services. Everyone leaving the Armed Forces is given a summary of their medical records, which they are advised to give to their new NHS doctor when they register with them. Veterans should be flagged with their GP as veterans within their NHS medical notes to help to ensure that they are able to access dedicated services for those who have served in the UK. A rigorous handover process – known as the Seriously Injured Leavers Protocol – is in place for veterans with any condition that may have been caused during service. The veterans personalised care programme is also in place for anyone who has a complex and lifelong health condition. Veterans can access all NHS services, including those services set up to meet the needs of veterans, like prosthetics and mental health which include treatments available to help people with the psychological consequences of exposure to traumatic events. As families and carers can be seriously impacted when their loved ones are injured, they can also be supported to access services that may help them.
The 2021 Census in England and Wales was the first to ask people if they had previously served in the UK armed forces. People aged 16 years and over were asked whether they had previously served in the regular or reserve UK armed forces, or both. People currently serving in the UK armed forces and those who had never served were both advised to tick “no”.
People who have previously served in the regular or reserve UK armed forces are often known as the veteran population and form part of the armed forces community (along with those who currently serve in the armed forces or Merchant Navy and their families). The question on UK armed forces veterans was added to better meet the needs for service providers and others who support veterans, in line with the Armed Forces Covenant.
Over three-quarters of UK armed forces veterans residing in England and Wales had previously served in the regular armed forces only (1.4 million, 76.3%), while 361,000 (19.5%) had served only in the reserve armed forces. The remaining 79,000 (4.3%) had served in both the regular and the reserve armed forces. Of the UK armed forces veteran population in England and Wales, 98.0% (1,816,299) lived in households and 2.0% (36,813) lived in communal establishments. This is similar to the breakdown for the population as a whole; 98.3% of usual residents in England and Wales lived in households and 1.7% lived in communal establishments. Seven percent of all households in England and Wales had at least one person who had previously served in the UK armed forces (1,745,078 households in total).
Veterans’ Survey 2022
The Veterans’ Survey 2022 was the first survey of its kind in the UK and was a collaboration between the Office for National Statistics (ONS), The Office for Veterans’ Affairs (who funded the survey), and the devolved administrations. It aimed to understand the experiences of veterans and their families. In total there were 28,957 veteran respondents.
The first results of the survey were published on 4 December 2024, covering the health and wellbeing of veterans, then on 10 January 2025 covering finance and housing and then on 23 April 2025 concerning employment. Further analysis will be published throughout 2025.
Veterans’ Survey 2022: Health and wellbeing of UK armed forces veterans
Just under half (48.7%) of veteran respondents were disabled (a much higher proportion than identified in Census 2021) and just under a third of veterans across the UK said they felt lonely always, often or some of the time (31.3%).
Loneliness and disability status were associated and, among disabled veterans, 39.4% felt lonely always, often or some of the time, compared with 22.9% of veterans who were not disabled.
Over three-quarters of veterans were registered with a dentist, and dentist registrations were associated with other health and wellbeing factors. Disabled veterans, and veterans who felt lonely always, often or some of the time, were less likely to have registered with a dentist than their counterparts.
The main reasons given by veterans for not registering with a dentist were “Because I found registering too difficult” and “Other”. Qualitative analysis of “Other” responses highlighted lack of NHS dentist availability, not being able to get a dentist in the local area and lengthy waiting lists to register with an NHS dentist as key themes.
Veterans’ Survey 2022: Finance and housing analysis of UK armed forces veterans
Among UK veterans who provided their gross personal income, 5.8% said their income was less than £10,400 a year, 43.6% said their income was between £10,400 and £31,099 a year, 29.7% said their income was between £31,100 and £51,949 a year, 16.3% said their income was between £51,950 and £99,999, and the remaining 4.6% said their income was £100,000 a year or more.
Disability has a known relationship with income, and when we consider those who were disabled, 7.9% said their income was £10,400 a year or less, compared with 3.7% of veterans that were not disabled.
Just over half (50.1%) of veterans disagreed to some extent and nearly a third (30.5%) agreed to some extent with the statement “In the last month I have had money worries”. This aligns with comparable data sources that have reported on anxiety or worry around finances among UK adults.
Around 1 in 400 (0.3%) veterans said they were homeless, rough sleeping or living in a refuge for domestic abuse, and 9 in 400 (2.3%) said they lived long-term with family or friends.
Just over 1 in 10 (10.8%) veterans that were homeless or rough sleeping said they had received government support, such as from Veterans UK or local councils; just over 1 in 20 (5.7%) veterans that were homeless or rough sleeping said they had received support from charities, such as Citizens Advice, Shelter or SPACES, to help with housing.
Veterans’ Survey 2022: Employment analysis of UK armed forces veterans
Of all survey respondents, across the UK, just under half (46.9%) of veterans were employed or self-employed and a similar proportion were retired (46.1%).
Nearly two-thirds of working veterans worked in the private sector (62.0%), just under a third worked in the public sector (29.7%), 5.7% were working in the non-profit or non-governmental sector and the remainder did not provide their job sector.
Just over 1 in 5 working veterans (20.9%) actively looked to change their main job in the last 4 weeks, most commonly because they wanted more pay or benefits, a better work-life balance or professional development.
Across the UK, just over half of veterans (52.5%) had ever taken a job at a lower experience or skill level than their last role in the UK armed forces, most commonly because there were no other jobs available, and employers did not recognise their transferable military skills.
Over 8 in 10 veterans felt they had transferable skills from the UK armed forces (85.4%) or had used skills from the UK armed forces in a civilian role (81.4%), and just over half of veterans (53.5%) had given unpaid help to clubs, groups, charities or organisations over the last 12 months.
The Hull Picture
Number of Veterans
Information from the 2021 Census
Across England and Wales, the local authorities with the highest proportion of veterans include Gosport (12.5%), North Kesteven (10.2%) and Richmondshire (9.5%). The local authorities with the highest proportion of households with at least one veteran were very similar; Gosport (21.2%) and North Kesteven (17.8%) were first and second, and Fareham was third (16.7%).
Among Hull’s population aged 16+ years, 10,079 (4.7%) recorded that they were veterans. This compares to 4.2% of the Yorkshire and Humber 16+ population and 3.8% of the 16+ population of England and Wales. Of the 331 local authorities in England and Wales, Hull has the 109th highest levels of people who recorded themselves as being veterans. This places in in the top third of local authorities in England and Wales.
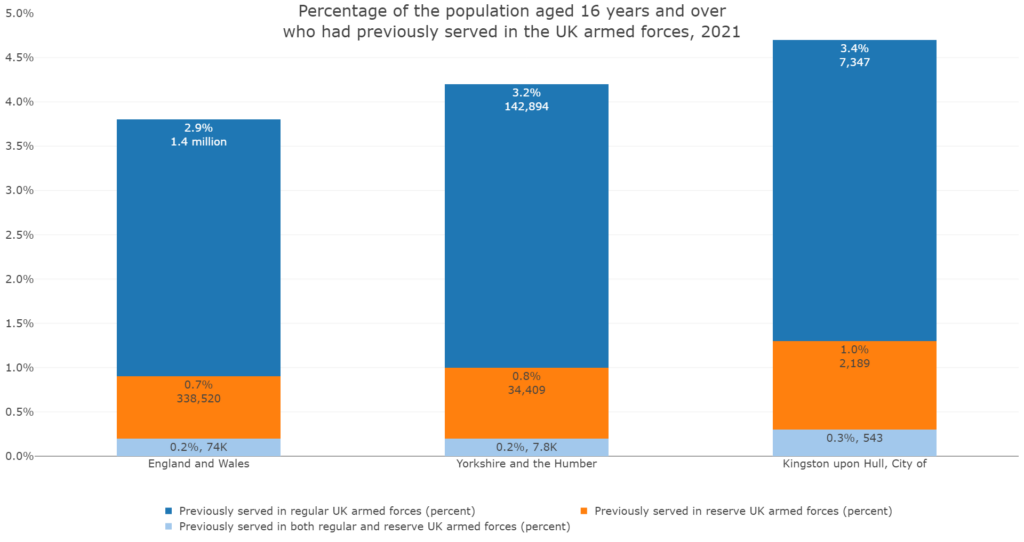
The 2021 Census asked people whether they had served in the regular or reserved services, or both. In Hull 3.4% of the 16+ population stated that they had served in the regular forces (7,347 people), 1.0% in the reserve forces (2,189 people), and 0.3% had served in both (543 people). All these percentages are greater than both the Yorkshire and Humber figures, as well as the England and Wales figures.
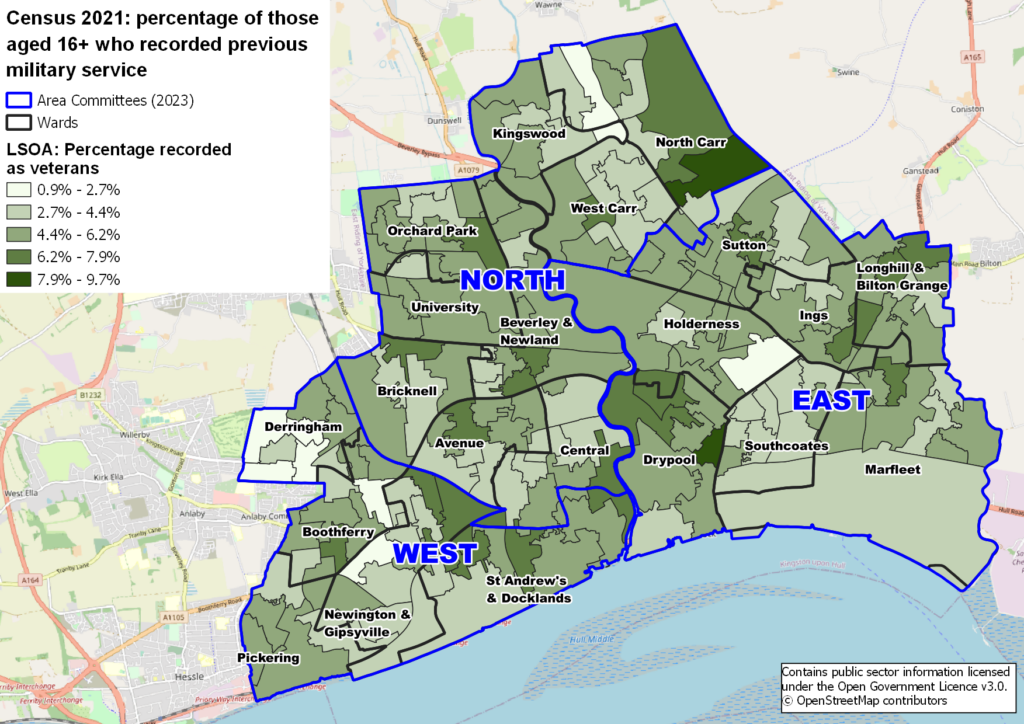
Across the City the highest percentage of veterans (those aged 16+ years who have previously served in the UK regular or reserve armed forces, or both) was recorded in Pickering and West Carr wards (both with 6.1%). The lowest levels were recorded in University ward where 2.7% of the 16+ aged population was recorded as being a veteran.
The lower layer super output area (LSOA; a geographical level) with the highest percentage of veterans is located in the North Carr ward. In this LSOA, 9.7% of the 16+ population (equivalent to almost one person in ten) were recorded as being veterans. The LSOA with the lowest percentage of veterans is located in Newington and Gipsyville ward. In this LSOA 0.9% of the 16+ population (equivalent to almost one person in 110) were recorded as being veterans.
| Ward | Veteran population 16+ (%) | Number of Veterans |
| Avenue | 3.4% | 369 |
| Beverley & Newland | 3.9% | 518 |
| Boothferry | 5.0% | 491 |
| Bricknell | 4.3% | 303 |
| Central | 3.6% | 314 |
| Derringham | 5.9% | 574 |
| Drypool | 4.8% | 483 |
| Holderness | 4.7% | 467 |
| Ings | 5.5% | 421 |
| Kingswood | 5.0% | 368 |
| Longhill & Bilton Grange | 5.7% | 567 |
| Marfleet | 5.1% | 522 |
| Newington & Gipsyville | 4.1% | 537 |
| North Carr | 5.0% | 557 |
| Orchard Park | 4.4% | 518 |
| Pickering | 6.1% | 424 |
| St Andrew’s & Docklands | 3.7% | 500 |
| Southcoates | 5.1% | 620 |
| Sutton | 5.9% | 650 |
| University | 2.7% | 268 |
| West Carr | 6.1% | 610 |
| Total | 4.7% | 10,081 |
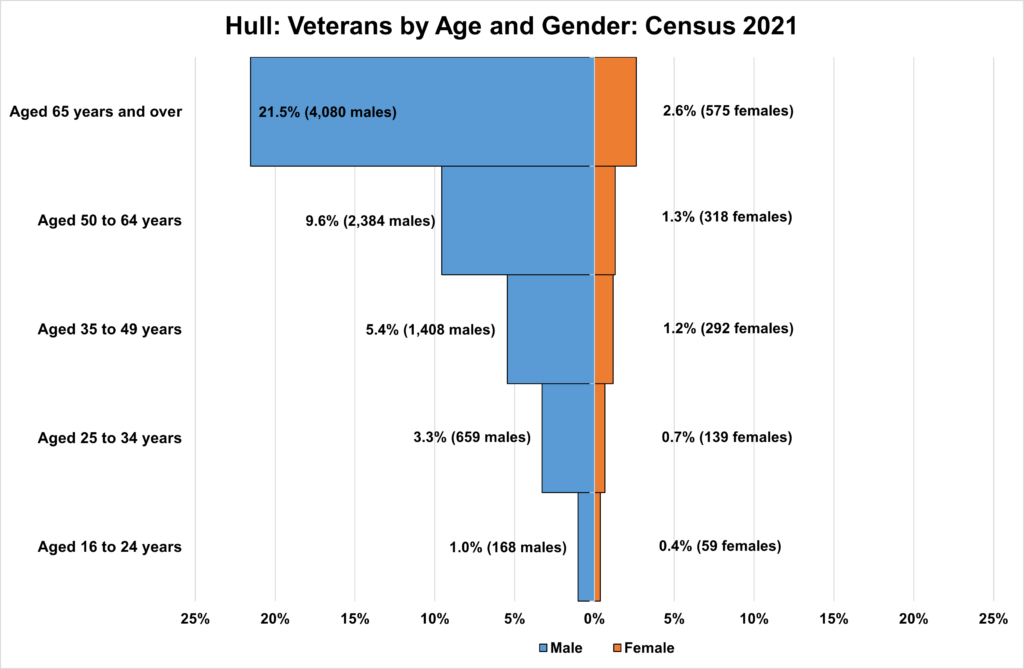
Whilst overall 4.7% of Hull’s 16+ population recorded that they were veterans, there is considerable difference with regards to gender and age. Overall 8.2% of 16+ males in Hull identified as veterans, whilst only 1.3% of 16+ females did so. There is considerable difference in the percentage of veterans when divided by age category. Whilst 1.0% of aged 16 to 24 years males in Hull identified as being a veteran, this increased considerably to 21.5% for those aged 65 years and over. To a lesser extent this larger figure will be due to military service during World War II, although the greater reason is likely due to National Service which saw males who were born before 1 October 1939 being liable for two years military service, being called up at some point between the ages of 17 and 21 years of age. The last of the National Service men left the military as recently as May 1963. And another reason will be the decrease in the size of the British military in recent history and fewer people joining. In 1964 (the year after National Service ended) there were 417,000 personnel in the British military – by 2022 this had decreased to 148,000 personnel.
| Age group | Hull (N) | Hull (%) | Yorkshire & Humber (%) | England (%) |
| 16-24 | 227 | 0.7 | 0.6 | 0.5 |
| 25-34 | 798 | 1.9 | 1.6 | 1.2 |
| 35-49 | 1,700 | 3.3 | 2.6 | 2.2 |
| 50-64 | 2,702 | 5.5 | 4.5 | 4.1 |
| 65+ | 4,655 | 11.4 | 9.1 | 8.9 |
| Total | 10,082 |
The distribution of veterans by age can be seen in the below table. In the 16 to 24 age group the larger percentage of veterans are recorded as being usually resident in University (5.6%), Beverley & Newland (4.6%), and Kingswood (3.5%) wards. Whilst at the older end of the spectrum in the aged 65 years and over group, the largest percentage of veterans is recorded in Pickering (58.6%), Beverley & Newland (53.3%), and Bricknell (53.0%).
| Aged 16 to 24 years | Aged 25 to 34 years | Aged 35 to 49 years | Aged 50 to 64 years | Aged 65 years and over | |
| Avenue | 3.0% (11) | 8.3% (31) | 22.0% (82) | 26.1% (97) | 40.6% (151) |
| Beverley & Newland | 4.6% (24) | 7.1% (37) | 12.1% (63) | 22.9% (119) | 53.3% (277) |
| Boothferry | 1.2% (6) | 7.7% (38) | 15.3% (75) | 26.3% (129) | 49.5% (243) |
| Bricknell | 3.3% (10) | 5.7% (17) | 13.7% (41) | 24.3% (73) | 53.0% (159) |
| Central | 2.2% (7) | 12.1% (38) | 14.1% (44) | 21.7% (68) | 49.8% (156) |
| Derringham | 2.8% (16) | 7.2% (41) | 14.1% (81) | 27.4% (157) | 48.5% (278) |
| Drypool | 0.4% (2) | 7.3% (35) | 18.1% (87) | 30.4% (146) | 43.8% (210) |
| Holderness | 1.9% (9) | 7.5% (35) | 19.8% (92) | 26.7% (124) | 44.0% (204) |
| Ings | 0.2% (1) | 5.5% (23) | 17.6% (74) | 25.7% (108) | 51.1% (215) |
| Kingswood | 3.5% (13) | 20.1% (74) | 35.5% (131) | 28.2% (104) | 12.7% (47) |
| Longhill & Bilton Grange | 3.0% (17) | 7.6% (43) | 14.4% (82) | 22.9% (130) | 52.1% (296) |
| Marfleet | 2.3% (12) | 8.2% (43) | 14.5% (76) | 26.0% (136) | 48.9% (256) |
| Newington & Gipsyville | 1.9% (10) | 9.1% (49) | 18.0% (97) | 29.6% (159) | 41.4% (223) |
| North Carr | 3.6% (20) | 11.3% (63) | 20.0% (111) | 27.0% (150) | 38.1% (212) |
| Orchard Park | 1.5% (8) | 4.2% (22) | 13.8% (72) | 30.5% (159) | 49.9% (260) |
| Pickering | 1.2% (5) | 5.9% (25) | 10.4% (44) | 24.0% (102) | 58.6% (249) |
| Southcoates | 2.1% (13) | 7.6% (47) | 20.3% (125) | 24.8% (153) | 45.1% (278) |
| St Andrew’s & Docklands | 2.6% (13) | 5.8% (29) | 17.1% (86) | 31.7% (159) | 42.8% (215) |
| Sutton | 1.2% (8) | 8.0% (52) | 14.1% (92) | 25.9% (169) | 50.8% (331) |
| University | 5.6% (15) | 6.4% (17) | 19.5% (52) | 28.6% (76) | 39.8% (106) |
| West Carr | 1.1% (7) | 7.1% (43) | 15.4% (94) | 29.4% (179) | 47.0% (286) |
| Total | 2.3% (227) | 8.0% (802) | 16.9% (1,701) | 26.8% (2,697) | 46.2% (4,652) |
It is to be expected that, as Hull has a larger percentage of veterans who are usually resident here than either the Yorkshire and the Humber region or England as a whole, the percentage of households in which a veteran lives is also higher in Hull. Whilst 8.0% of Hull households have one person who is a veteran, this is 7.2% in the region and 6.7% in England. There is little difference in those households with two or more veterans, with Hull, the region and England all recording 0.3%.
| Previously served in UK armed forces | Hull (N) | Hull (%) | Yorkshire & Humber (%) | England (%) |
| One veteran in household | 9,253 | 8.0% | 7.2% | 6.7% |
| Two or more veterans in household | 318 | 0.3% | 0.3% | 0.3% |
| No veterans in household | 105,901 | 91.7% | 92.5% | 93.0% |
Veterans Registered with Local General Practices
A total of 3,740 people and their dependents were registered as veterans on the GP clinical system in Hull in 2022 (2,003 men and 1,737 women). For each age group except those aged 71+ years, there were more men than women, and the largest numbers occurred in the older age groups in particular among those aged 51-60 years. Given the results of the 2021 Census, these figures would appear to show that significant numbers of veterans are not recorded as such on Hull GPs’ systems and the numbers are far higher than this.
Housing, Employment and Health of Veterans
Information from 2021 Census
Housing
In Hull, if you are a veteran, you are more likely to live in rented accommodation whether social rented accommodation (owned by the local authority or another body) or privately owned, than compared with the Yorkshire and the Humber region and England averages, and therefore less likely to live in your own home which you either own outright or have a loan/mortgage and share ownership with someone else. However, home ownership is different in Hull relative to the region and England for all residents (not just veterans) with more information presented in Housing and Households under Health and Wellbeing Influences.
Economic Activity
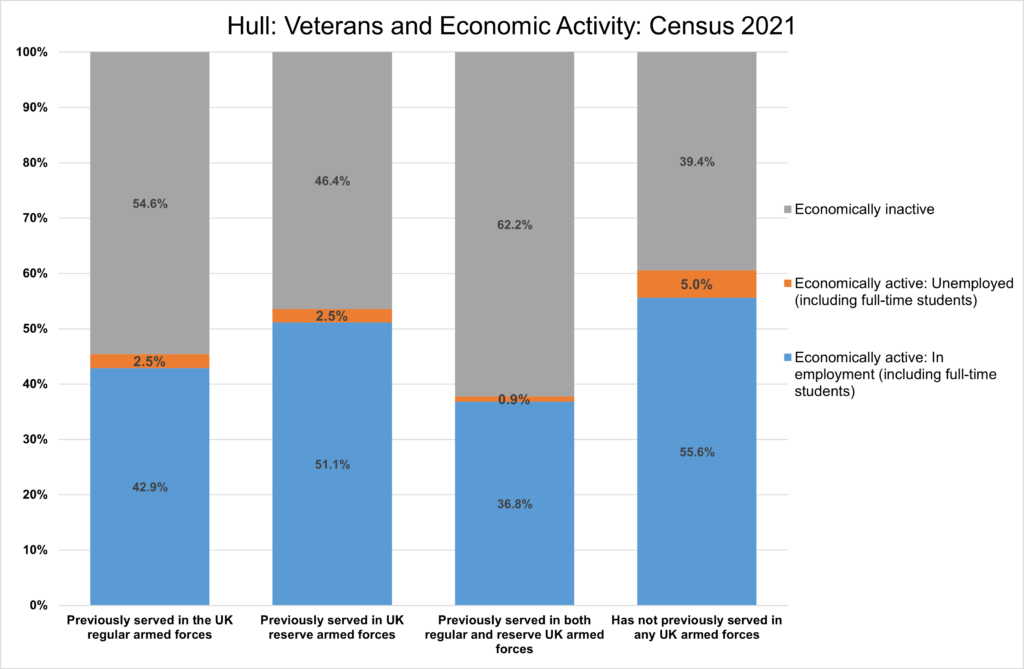
In Hull, those who are not veterans are more likely to be economically active than those who are not veterans.
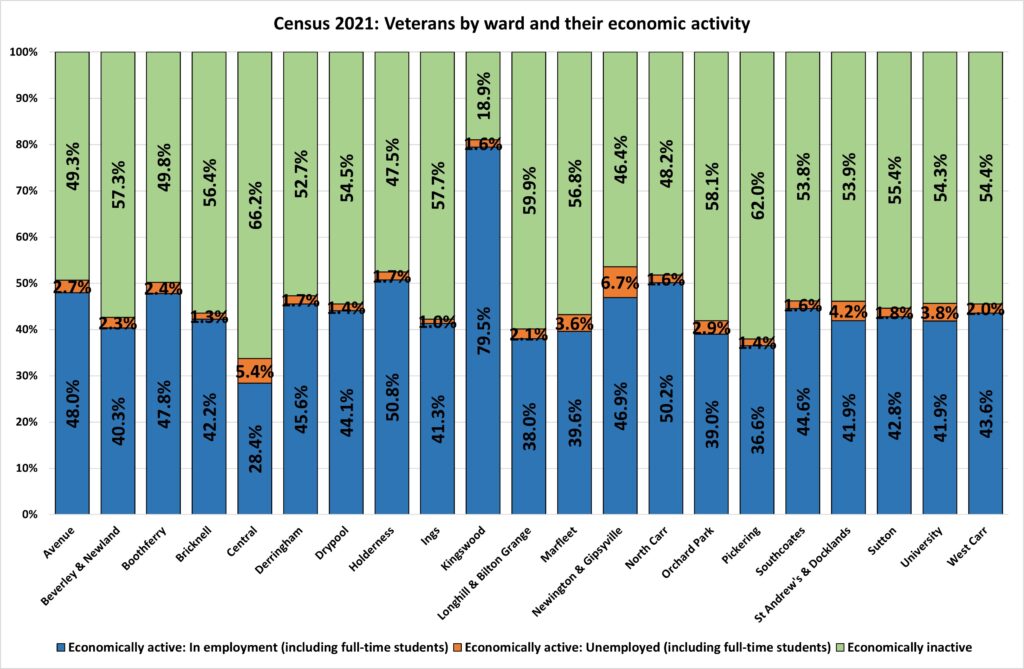
Economic activity also varied for the veterans depending on the ward they lived within, although economic activity of all residents differs across Hull not just for veterans.
Broken down by age, it is only in the aged 65 years and over age group that it is more likely non-veterans are economically active compared to veterans. Otherwise, in all the age groups below that, it is more likely that a veteran will be economically active.
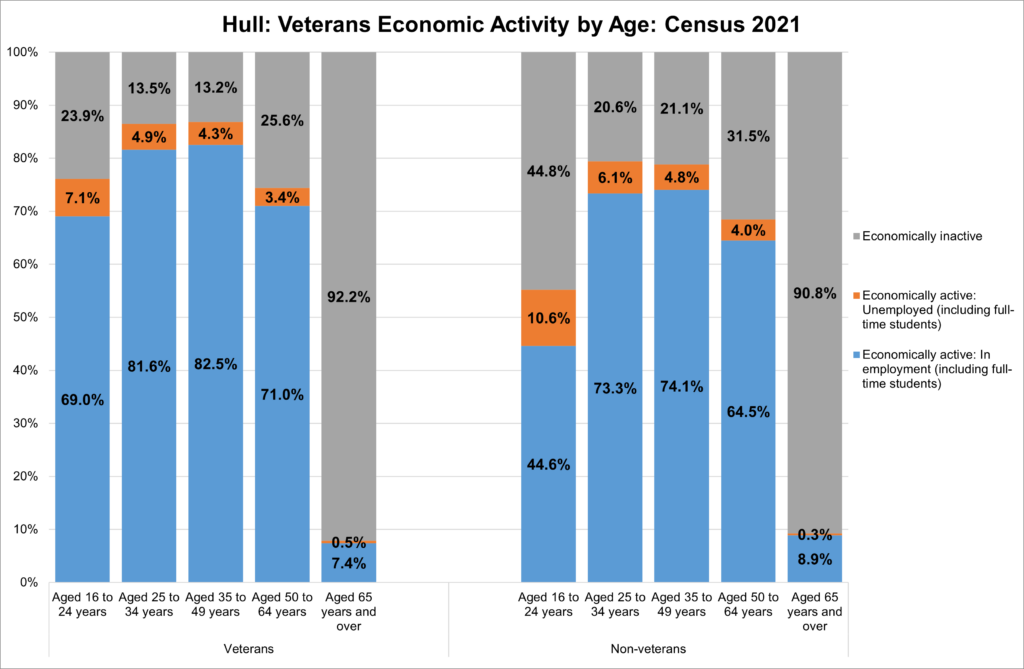
| Age Group | Economically active: In employment (including full-time students) | Economically active: Unemployed (including full-time students) | Economically inactive | |
| Veterans | Aged 16 to 24 years | 69.0% (156) | 7.1% (16) | 23.9% (54) |
| Aged 25 to 34 years | 81.6% (653) | 4.9% (39) | 13.5% (108) | |
| Aged 35 to 49 years | 82.5% (1,403) | 4.3% (73) | 13.2% (224) | |
| Aged 50 to 64 years | 71.0% (1,918) | 3.4% (92) | 25.6% (692) | |
| Aged 65 years and over | 7.4% (343) | 0.5% (22) | 92.2% (4,288) | |
| Non- Veterans | Aged 16 to 24 years | 44.6% (14,091) | 10.6% (3,344) | 44.8% (14,144) |
| Aged 25 to 34 years | 73.3% (29,511) | 6.1% (2,456) | 20.6% (8,274) | |
| Aged 35 to 49 years | 74.1% (36,382) | 4.8% (2,344) | 21.1% (10,387) | |
| Aged 50 to 64 years | 64.5% (30,109) | 4.0% (1,865) | 31.5% (14,718) | |
| Aged 65 years and over | 8.9% (3,221) | 0.3% (117) | 90.8% (32,833) |
Health and Disability
For those Hull residents who have not previously served in any UK armed forces 22.8% have a disability which comes under the Equality Act, compared with 21.0% in the Yorkshire and the Humber region and 19.4% nationally. However, for those people who are veterans they are more likely to be disabled. For those Hull residents who have previously served in the UK regular armed forces, 34.9% have a disability that comes under the Equality Act, whilst for the Yorkshire and the Humber region this figure is 33.6% and nationally the figure is 33.3%.
At individual ward level there are marked differences in the percentage of veterans who are recognised as having disabilities. Whilst 83.7% of veterans who are usually resident in Kingswood are not disabled, this falls to 52.5% in Central ward. 25.8% of veterans who are normally resident in Central are disabled under the Equality Act and their day-to-day activities are limited a lot – this is only 4.6% of veterans who are normally resident in Kingswood. 25.0% of veterans who are normally resident in St Andrew’s & Docklands are disabled under the Equality Act and their day-to -day activities are limited a little, whilst this is only 11.7% in Kingswood.
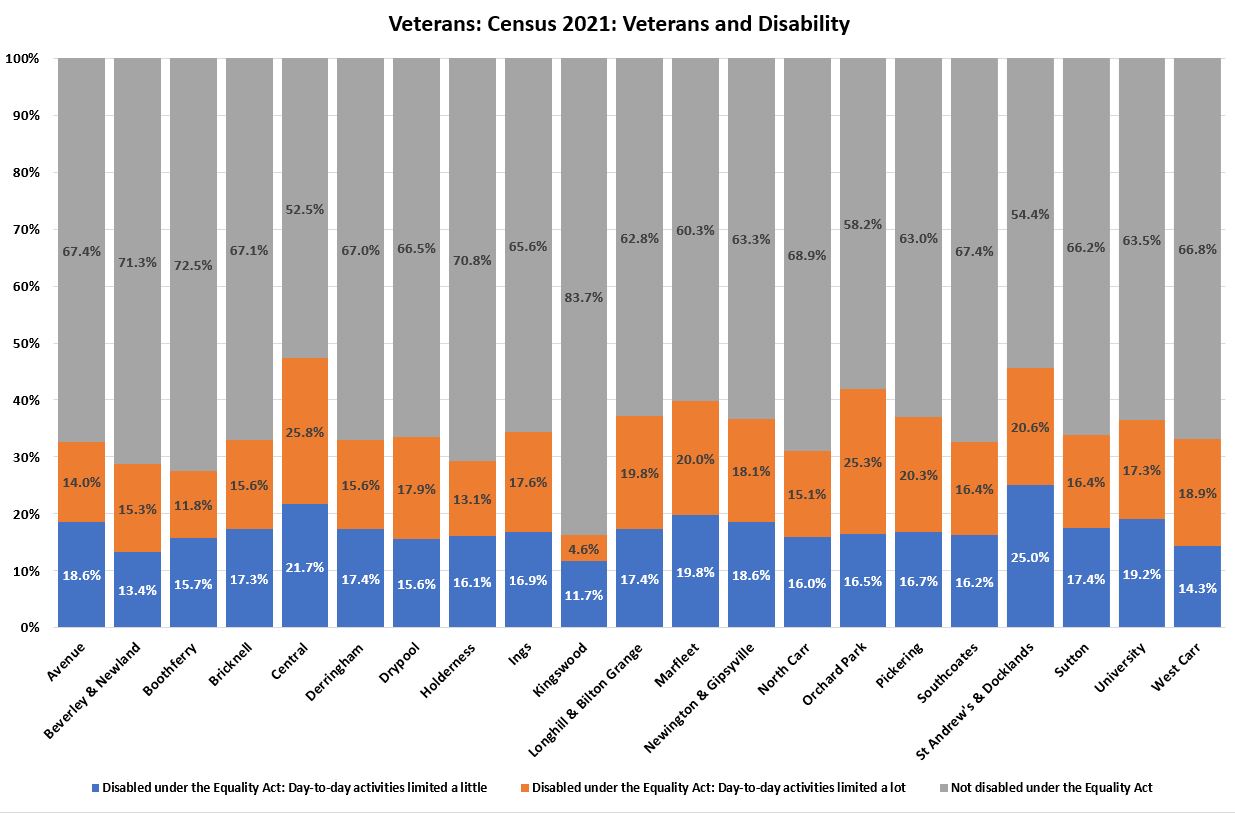
At individual ward level there are marked differences in the percentage of veterans who are recognised as having disabilities. Whilst 83.7% of veterans who are usually resident in Kingswood are not disabled, this falls to 52.5% in Central ward. 25.8% of veterans who are normally resident in Central are disabled under the Equality Act and their day-to-day activities are limited a lot – this is only 4.6% of veterans who are normally resident in Kingswood. 25.0% of veterans who are normally resident in St Andrew’s & Docklands are disabled under the Equality Act and their day-to -day activities are limited a little, whilst this is only 11.7% in Kingswood.
| Disabled under the Equality Act: day-to-day activities limited a little | Disabled under the Equality Act: day-to-day activities limited a lot | Not disabled under the Equality Act | |
| Avenue | 18.6% | 14.0% | 67.4% |
| Beverley & Newland | 13.4% | 15.3% | 71.3% |
| Boothferry | 15.7% | 11.8% | 72.5% |
| Bricknell | 17.3% | 15.6% | 67.1% |
| Central | 21.7% | 25.8% | 52.5% |
| Derringham | 17.4% | 15.6% | 67.0% |
| Drypool | 15.6% | 17.9% | 66.5% |
| Holderness | 16.1% | 13.1% | 70.8% |
| Ings | 16.9% | 17.6% | 65.6% |
| Kingswood | 11.7% | 4.6% | 83.7% |
| Longhill & Bilton Grange | 17.4% | 19.8% | 62.8% |
| Marfleet | 19.8% | 20.0% | 60.3% |
| Newington & Gipsyville | 18.6% | 18.1% | 63.3% |
| North Carr | 16.0% | 15.1% | 68.9% |
| Orchard Park | 16.5% | 25.3% | 58.2% |
| Pickering | 16.7% | 20.3% | 63.0% |
| Southcoates | 16.2% | 16.4% | 67.4% |
| St Andrew’s & Docklands | 25.0% | 20.6% | 54.4% |
| Sutton | 17.4% | 16.4% | 66.2% |
| University | 19.2% | 17.3% | 63.5% |
| West Carr | 14.3% | 18.9% | 66.8% |
Local People’s Panel and Armed Forces Covenant 2017 and 2022 Surveys
As mentioned above, the People’s Panel in November 2017 included questions on the Armed Forces Covenant. As well as the 1,209 responses from members of the general public in Hull, there were a further 185 general public responses from people who lived in East Riding of Yorkshire, and 114 and 31 responses from people living in North East Lincolnshire and North Lincolnshire respectively of whom the majority were currently serving or had previous served in the Armed Forces (57.0% and 74.2% respectively). In September 2022 a further survey about the Armed Forces Covenant just for Hull residents was conducted.
In the earlier survey, among the people living in Hull, 60.3% thought it most useful to focus on housing, 9.9% on adult education, 63.6% on employment (including self-employment and training), 5.6% on care (including childcare and care at home), 23.7% on money matters, benefits, etc, 28.8% on physical health and 75.7% on mental health. Among all survey responders across all four local authorities, people who currently served in the Armed Forces placed thought more focus should be placed on adult education, money matters, and physical and mental health compared to people who had never served in the Armed Forces. People who had previously served in the Armed Forces also thought that more focus should be on adult education, money matters and mental health, but additionally that focus should be on employment compared to people who had never served. Only a slightly higher percentage of people who had previously served also thought that the focus on physical health compared to those who had never been in the Armed Forces, in contrast to those who were currently serving.
In the latest survey a similar picture was seen in the areas respondents wished attention to be focused for veterans.
| Area of focus | 2017 survey | 2022 survey |
| Housing | 60% | 60% |
| Adult education | 10% | 23% |
| Employment (including self-employment and training) | 64% | 58% |
| Care (childcare, care at home etc.) | 6% | 12% |
| Money matters, benefits etc. | 24% | 42% |
| Physical health | 29% | 25% |
| Mental health | 76% | 65% |
| Other | 1% | 0% |
The findings suggest that the priorities should remain the same mental health (65%), housing (60%), employment, training and self employment (58%) However there was a significant increase in the number who felt money matters and benefits should be an area to focus on – from 24% in 2017 to 42% in the latest survey.
Local Survey of Veterans Health Needs 2009
A local survey of veterans’ health needs and lifestyle behaviours was conducted in Hull in 2009. A small number of veterans also participated in some in-depth interviews. Whilst the survey is relatively old, it is possible that it can inform services providers of some of the health and other issues faced by veterans in Hull. Further information is given under Local Surveys Involving Adults under Tools and Resources.
Strategic Need and Service Provision
Specialist dedicated services are available at a local and national level for veterans who have physical and/or mental health needs as a result of their service in the Armed Forces. Veterans who are not flagged as a veteran on the NHS medical records, should be encouraged to inform their GP that they are a veteran so that they have access to these services.
The Veterans’ Mental Health Transition, Intervention and Liaison Service (Part of Ops Courage) is a local dedicated out-patient service for service personnel approaching discharge from the Armed Forces and veterans who are experiencing mental health difficulties.
Additional support is available for veterans and their spouses from the Armed Forces Community Hub at the Octagon such as specialist employment support, money advice from the Citizen Advice Bureau (CAB) Armed Forces Project or support to complete housing applications from Hull4Heroes.
Resources
Office for Veterans’ Affairs. Veterans Factsheet 2020.
NHS. Healthcare for the armed forces community. www.nhs.uk
Hull’s Veteran’s Health and Wellbeing Survey 2009
Hull City Council. Support for Armed Forces personnel and veterans. https://www.hull.gov.uk/benefits-support-and-welfare-advice/welfare-advice/support-armed-forces-personnel-and-veterans
Op COURAGE NHS Veterans Mental Health and Wellbeing Services Humber and North Yorkshire. Op COURAGE NHS Veterans Mental Health and Wellbeing Services Humber and North Yorkshire | Humber Teaching NHS Foundation Trust
UK Armed Forces Veterans: Census 2021 in England and Wales. Office for National Statistics, 2022. https://www.ons.gov.uk/releases/ukarmedforcesveteranscensus2021inenglandan
Updates
This page was last updated / checked on 21 May 2025.
This page is due to be updated / checked in May 2026.